A Comparative Study of YOLOv11 and YOLOv12 on COCO and VisDrone Datasets
By: Jan Pastor & Vince Madrigal
Abstract
This project presents a side-by-side analysis of YOLOv11 and YOLOv12 across five model sizes using both COCO and VisDrone datasets. While YOLOv12 achieves higher benchmark scores on COCO due to newer innovations like R-ELAN and FlashAttention, YOLOv11 demonstrates superior real-world performance on dense aerial scenes, particularly in generalization and inference latency. YOLOv11m stood out with 0.48 mAP@0.5 in just 1.92 ms.
INtroduction
This project focused on evaluating how YOLOv11 and YOLOv12 perform across different model sizes and datasets. While YOLOv12 introduced architectural upgrades like R-ELAN and FlashAttention, we wanted to test whether those improvements carried over to real-world use cases like drone footage, where scenes are cluttered, objects are small, and occlusion is common.
Research Question: How do YOLOv12’s new modules (R-ELAN, FlashAttention, 7×7 convolutions) compare against YOLOv11’s simpler C3k2+C2PSA backbone in aerial scenes—both in accuracy and latency?
I was responsible for training and validating the YOLOv12 models. I handled data preparation, ran experiments using Colab Pro+, and verified results against standard object detection metrics. The goal was to find out which model worked best for high-speed, high-accuracy aerial detection.
APPROACH
Data & Pretraining
We started with COCO-pretrained weights for both YOLOv11 and YOLOv12 across five model sizes (n, s, m, l, x). From there, we fine-tuned each model on the VisDrone dataset using a 640×640 input resolution and a batch size of 16. All default training parameters were kept consistent to ensure a fair comparison. This allowed us to evaluate how each architecture handled the trade-off between model capacity and real-time performance, especially when applied to aerial scenes.
Training Regimen
Training was run for up to 300 epochs with early stopping enabled. We used Ultralytics’ YOLO CLI to keep hyperparameters consistent across all experiments. This made it easier to control for variables and keep logs reproducible throughout the training and validation phases.
Evaluation Metrics
We evaluated each model using mAP@0.5 along with precision–recall and F1–confidence curves to track detection quality and threshold sensitivity. Confusion matrices helped visualize which object classes were being misclassified. To measure how much performance dropped when switching domains (COCO to VisDrone), we also calculated the generalization gap and retention ratio. These metrics helped highlight how well each model handled domain shift in practical scenarios.
Architectural Differences
All YOLO models follow a common three-part structure:
Backbone – Extracts visual features from the input image
Neck – Aggregates and fuses features at multiple scales
Head – Outputs final predictions including object classes, bounding boxes, and confidence scores
Figure 1 below shows the architecture of the YOLOv11 model, highlighting its backbone, neck, and head components used for multi-scale object detection:
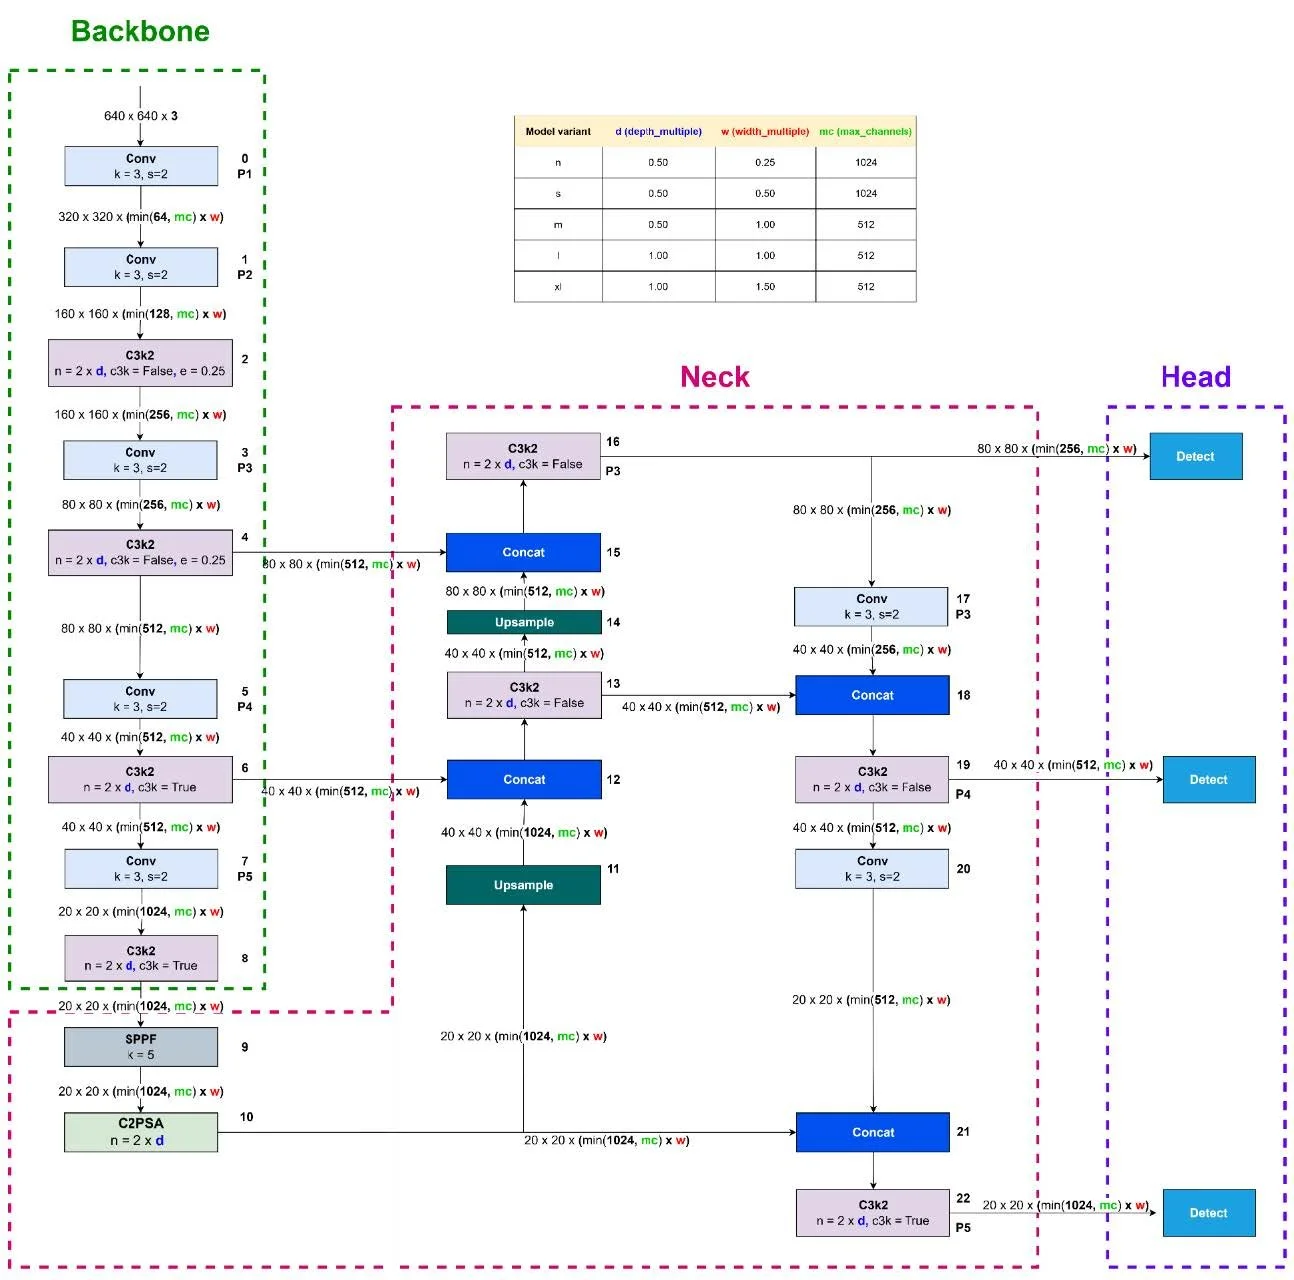
Figure 1 – YOLOv11 Architecture with Backbone, Neck, and Head Modules
While YOLOv11 and YOLOv12 share this general structure, they differ in the specific modules used within each section.
YOLOv11 follows the typical YOLO structure—Backbone, Neck, and Head—but integrates streamlined modules to improve spatial reasoning and attention without adding significant computational overhead.
C3k2: A lightweight variant of the C3 block used in the backbone. It reduces complexity by splitting and partially routing features through bottleneck layers. This improves spatial representation while maintaining fast inference, especially in lower-capacity models.
C2PSA: A dual-path spatial attention module placed after the SPPF block in the backbone. It splits features into two branches, each processed by a PSABlock, then merges them to enhance focus on relevant spatial cues—especially useful for small or occluded objects in aerial imagery.
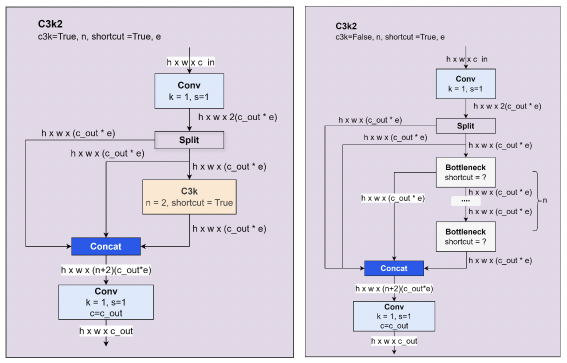
Figure 2 – Comparison of C3k2 Block Variants with and without Shortcut Connections

Figure 3 – Structure of the C2PSA Attention Module and Internal PSABlock Components
YOLOv12 follows the same high-level structure as YOLOv11—Backbone, Neck, and Head—but introduces several new modules aimed at improving feature propagation, spatial attention, and receptive field coverage. These components are detailed in both Ultralytics documentation and recent architecture papers.
R-ELAN (Residual Efficient Layer Aggregation Network): A deeper, more layered backbone that improves feature reuse and gradient flow through residual connections and extended branch paths. It builds on the original ELAN design with additional convolutional stages and skip connections to better preserve semantic information across depth.
FlashAttention (Area Attention): An attention mechanism designed for memory efficiency and scalability. It segments feature maps into fixed spatial areas and applies attention within each region, enabling the network to capture long-range dependencies without the high memory cost of standard self-attention.
7×7 Separable Convolutions: Integrated into the neck to increase the receptive field without significantly increasing parameter count. The separable design splits each 7×7 kernel into depthwise and pointwise operations, expanding spatial context while maintaining model efficiency.
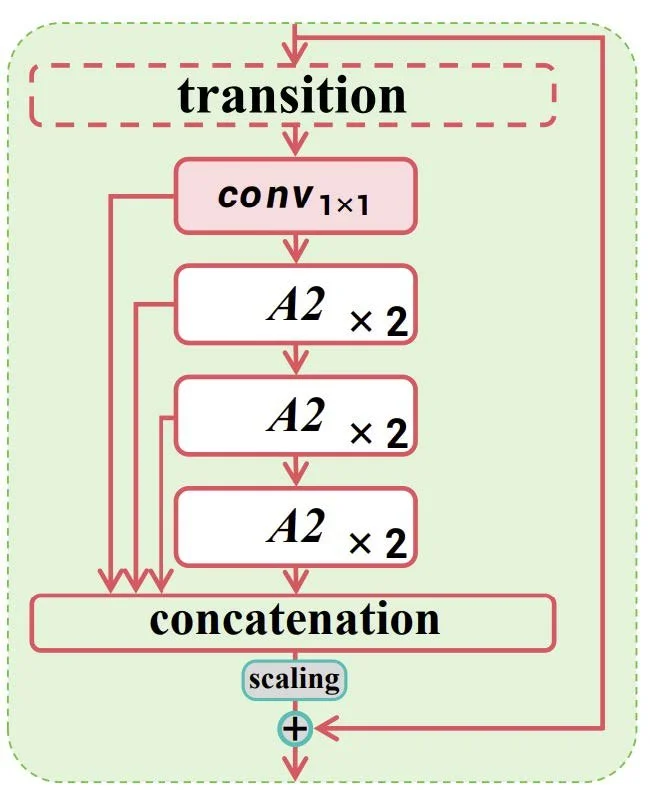
Figure 4 – Structure of the R-ELAN Module with Multi-Path Feature Aggregation and Scaling
Both versions are implemented in Ultralytics’ modular framework and are available in five model sizes (n, s, m, l, x) to match different hardware constraints and latency targets.
REsults
While all five model sizes (n, s, m, l, x) were evaluated, we focused our analysis on the “s” (small) and “x” (extra-large) variants. These two represent opposite ends of the deployment spectrum and provide the clearest view of the performance trade-offs between speed and accuracy.
The “s” models are optimized for low-latency inference, making them ideal for edge devices, embedded systems, or real-time UAV applications where quick response is critical—even if that comes at the cost of some accuracy.
The “x” models, by contrast, are designed for maximum detection accuracy, typically deployed on powerful systems where compute resources are available, and inference time is less constrained.
By comparing these two tiers, we get a representative picture of how each YOLO architecture (v11 vs. v12) behaves under resource-constrained vs. high-accuracy use cases. The results show how well each architecture scales across this trade-off, and whether newer innovations in YOLOv12 meaningfully improve real-world performance in either domain.
Precision-Recall
Precision-Recall of Small Variants (YOLOv11s vs. YOLOv12s):
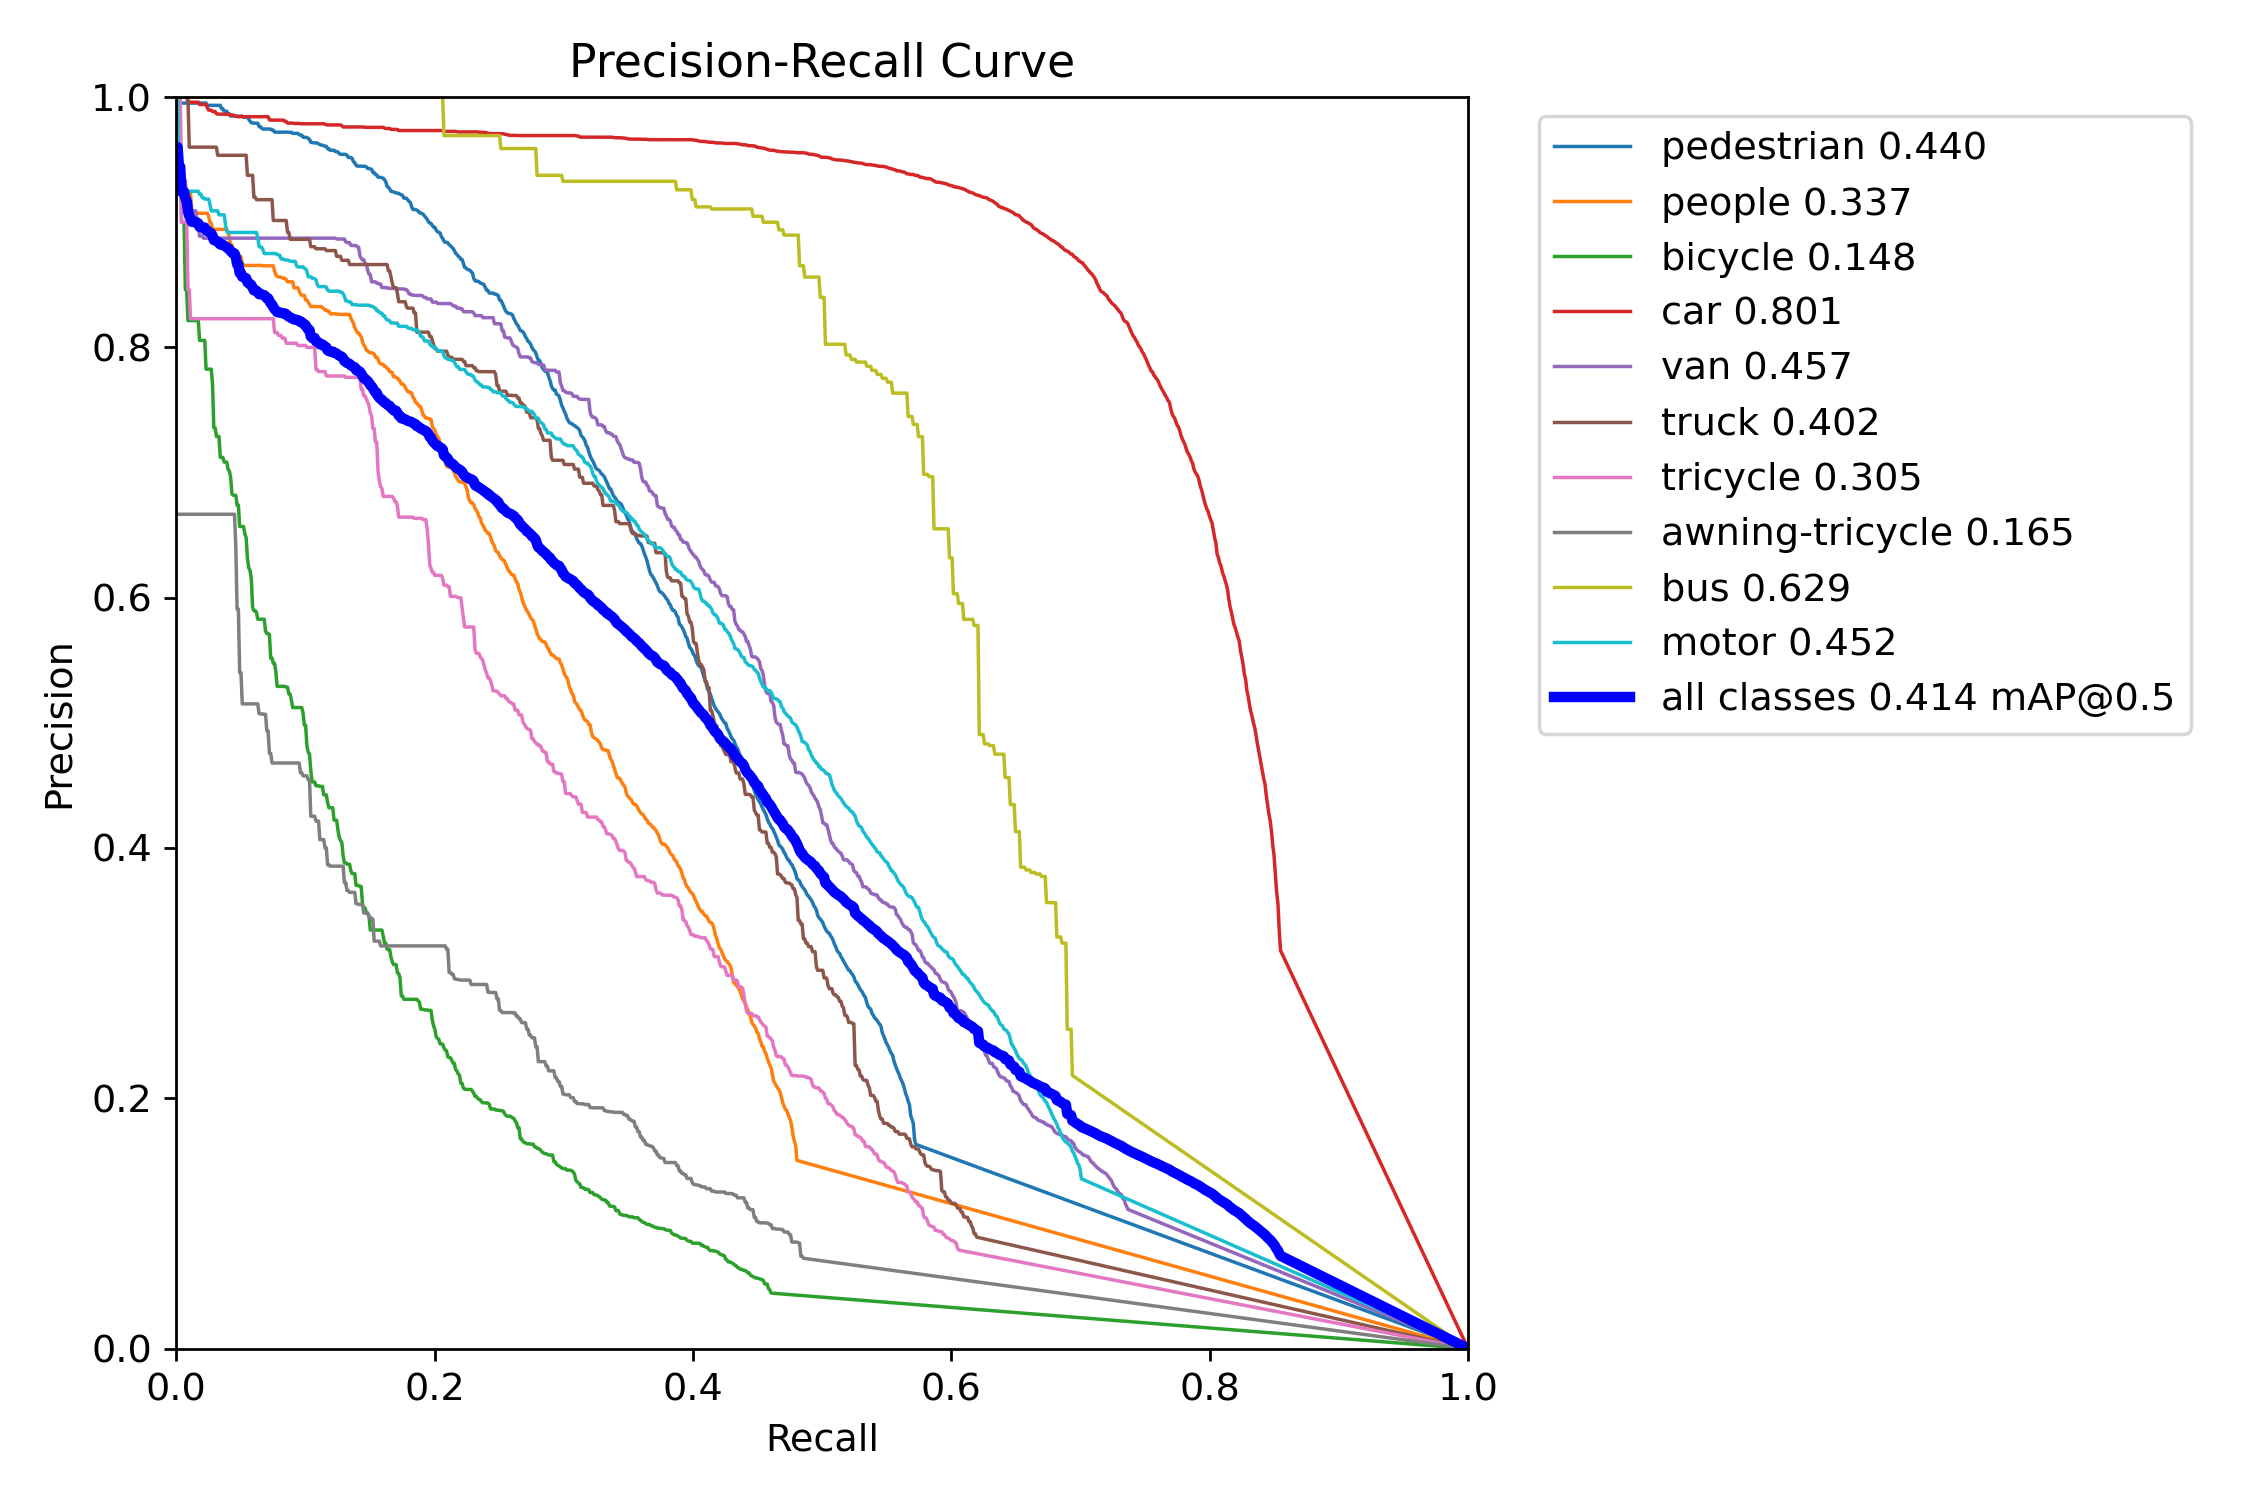
Figure 5 – YOLOv11s training precision–recall curve
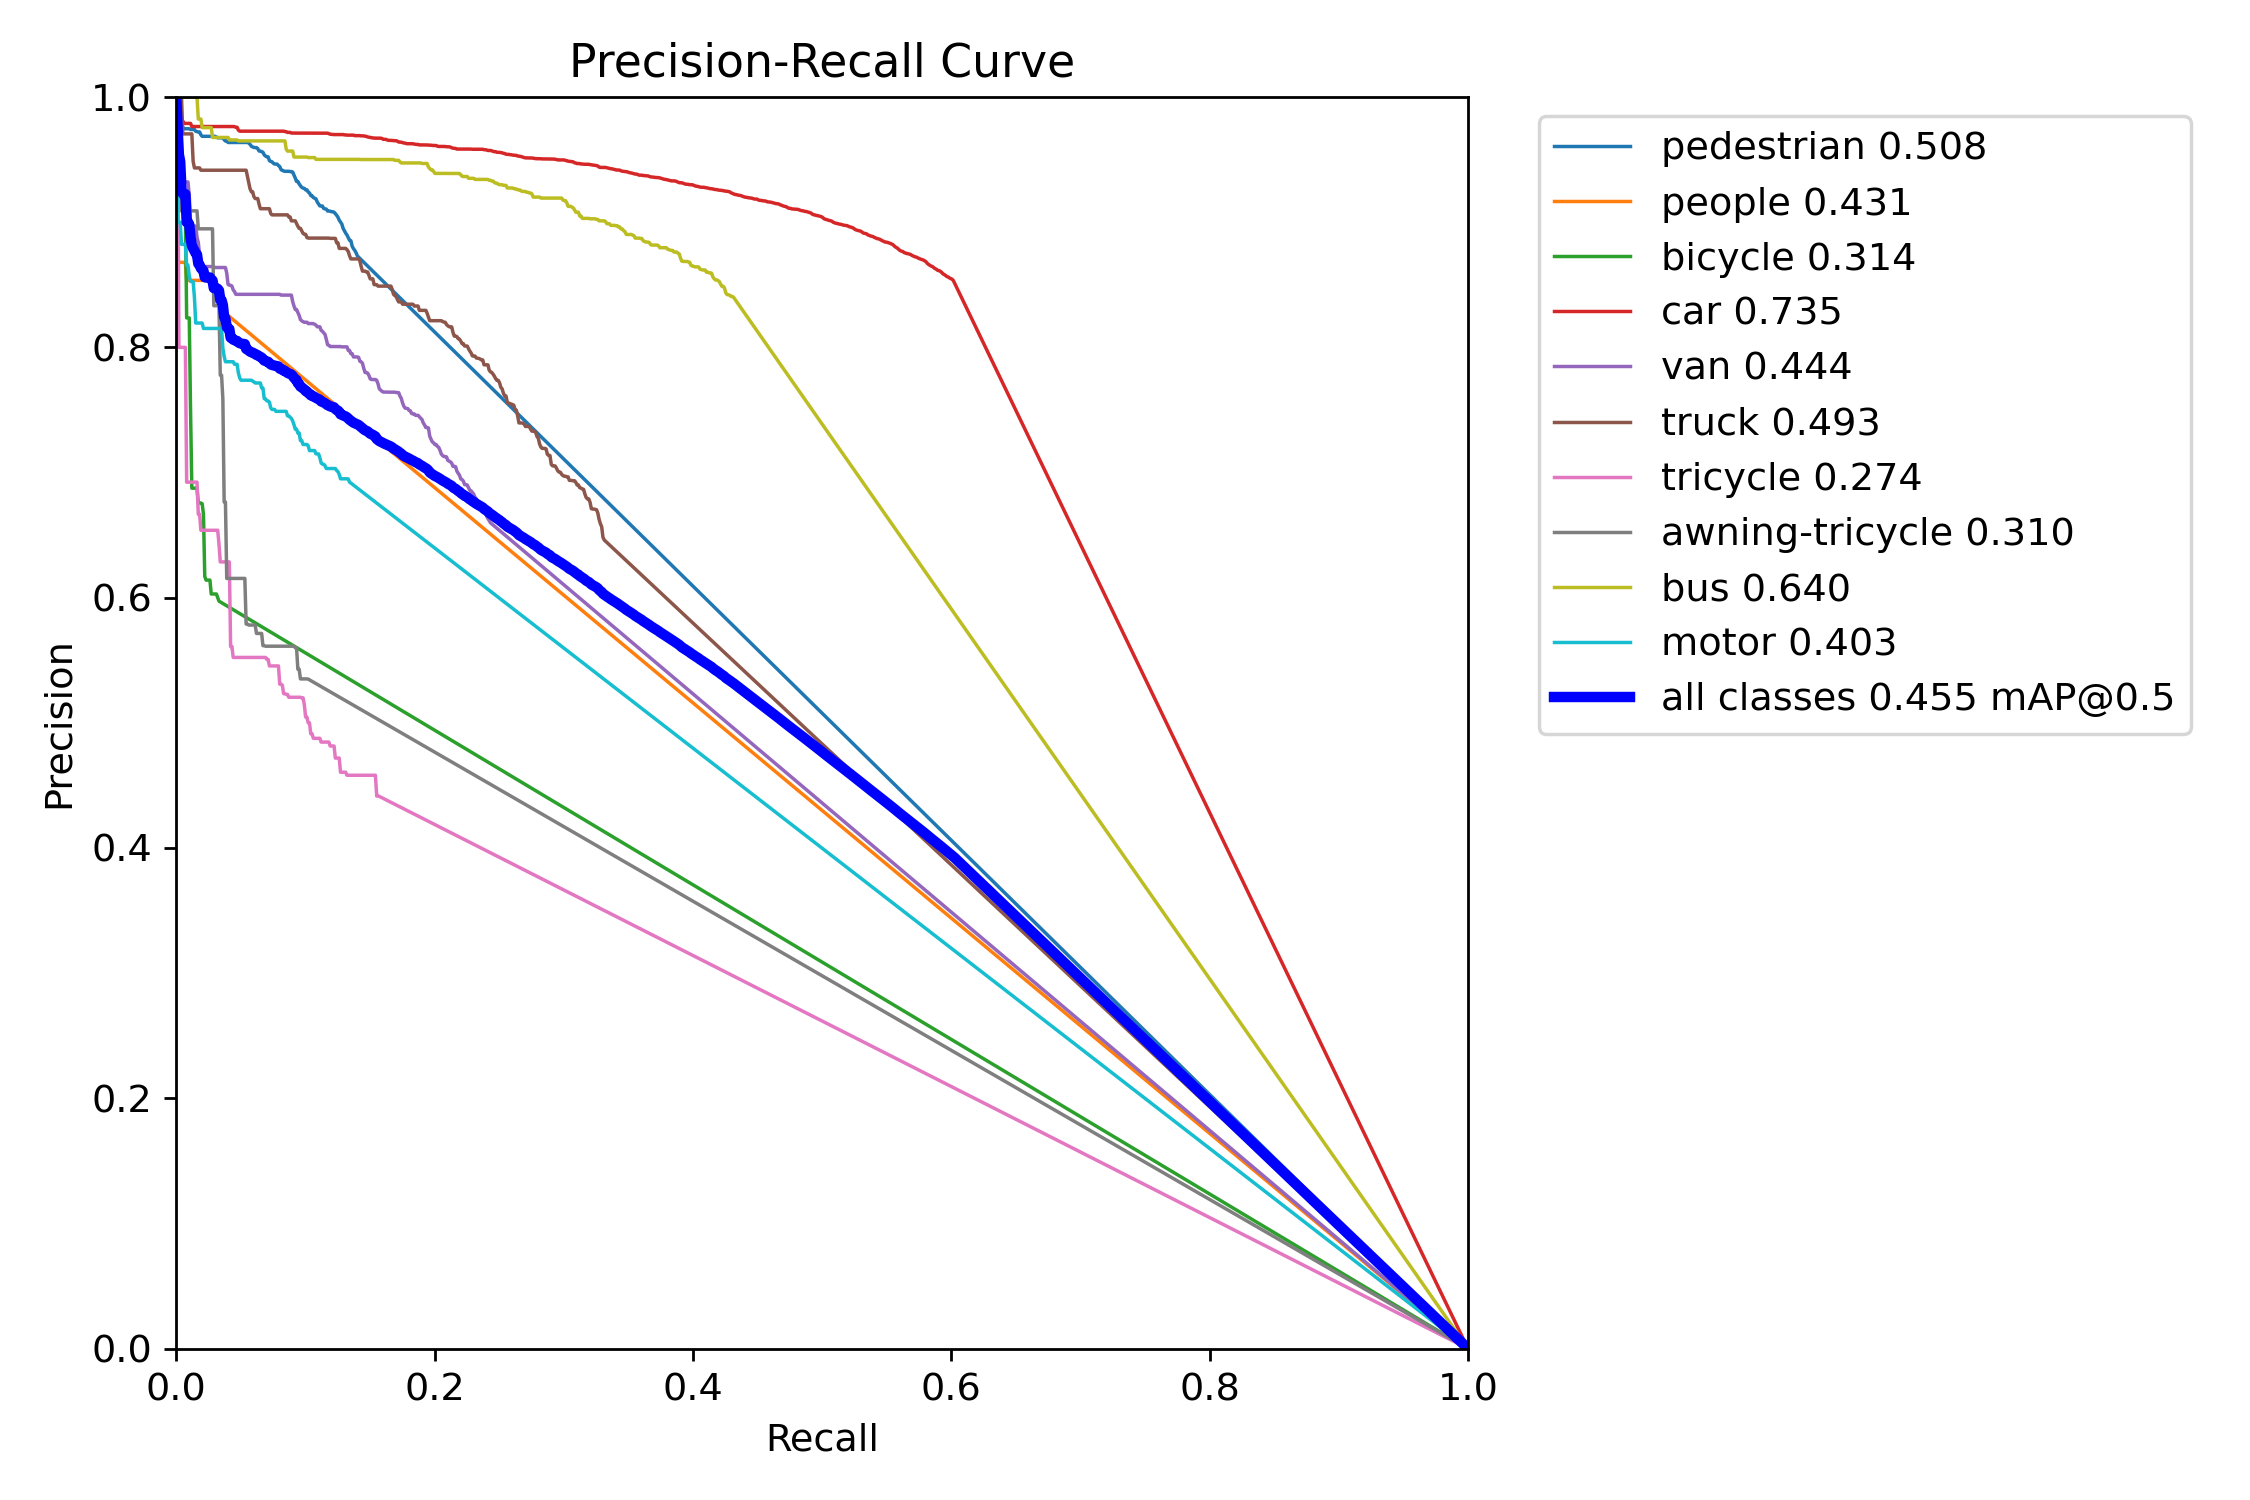
Figure 7 – YOLOv11s test precision–recall curve

Figure 6 – YOLOv12s training precision–recall curve
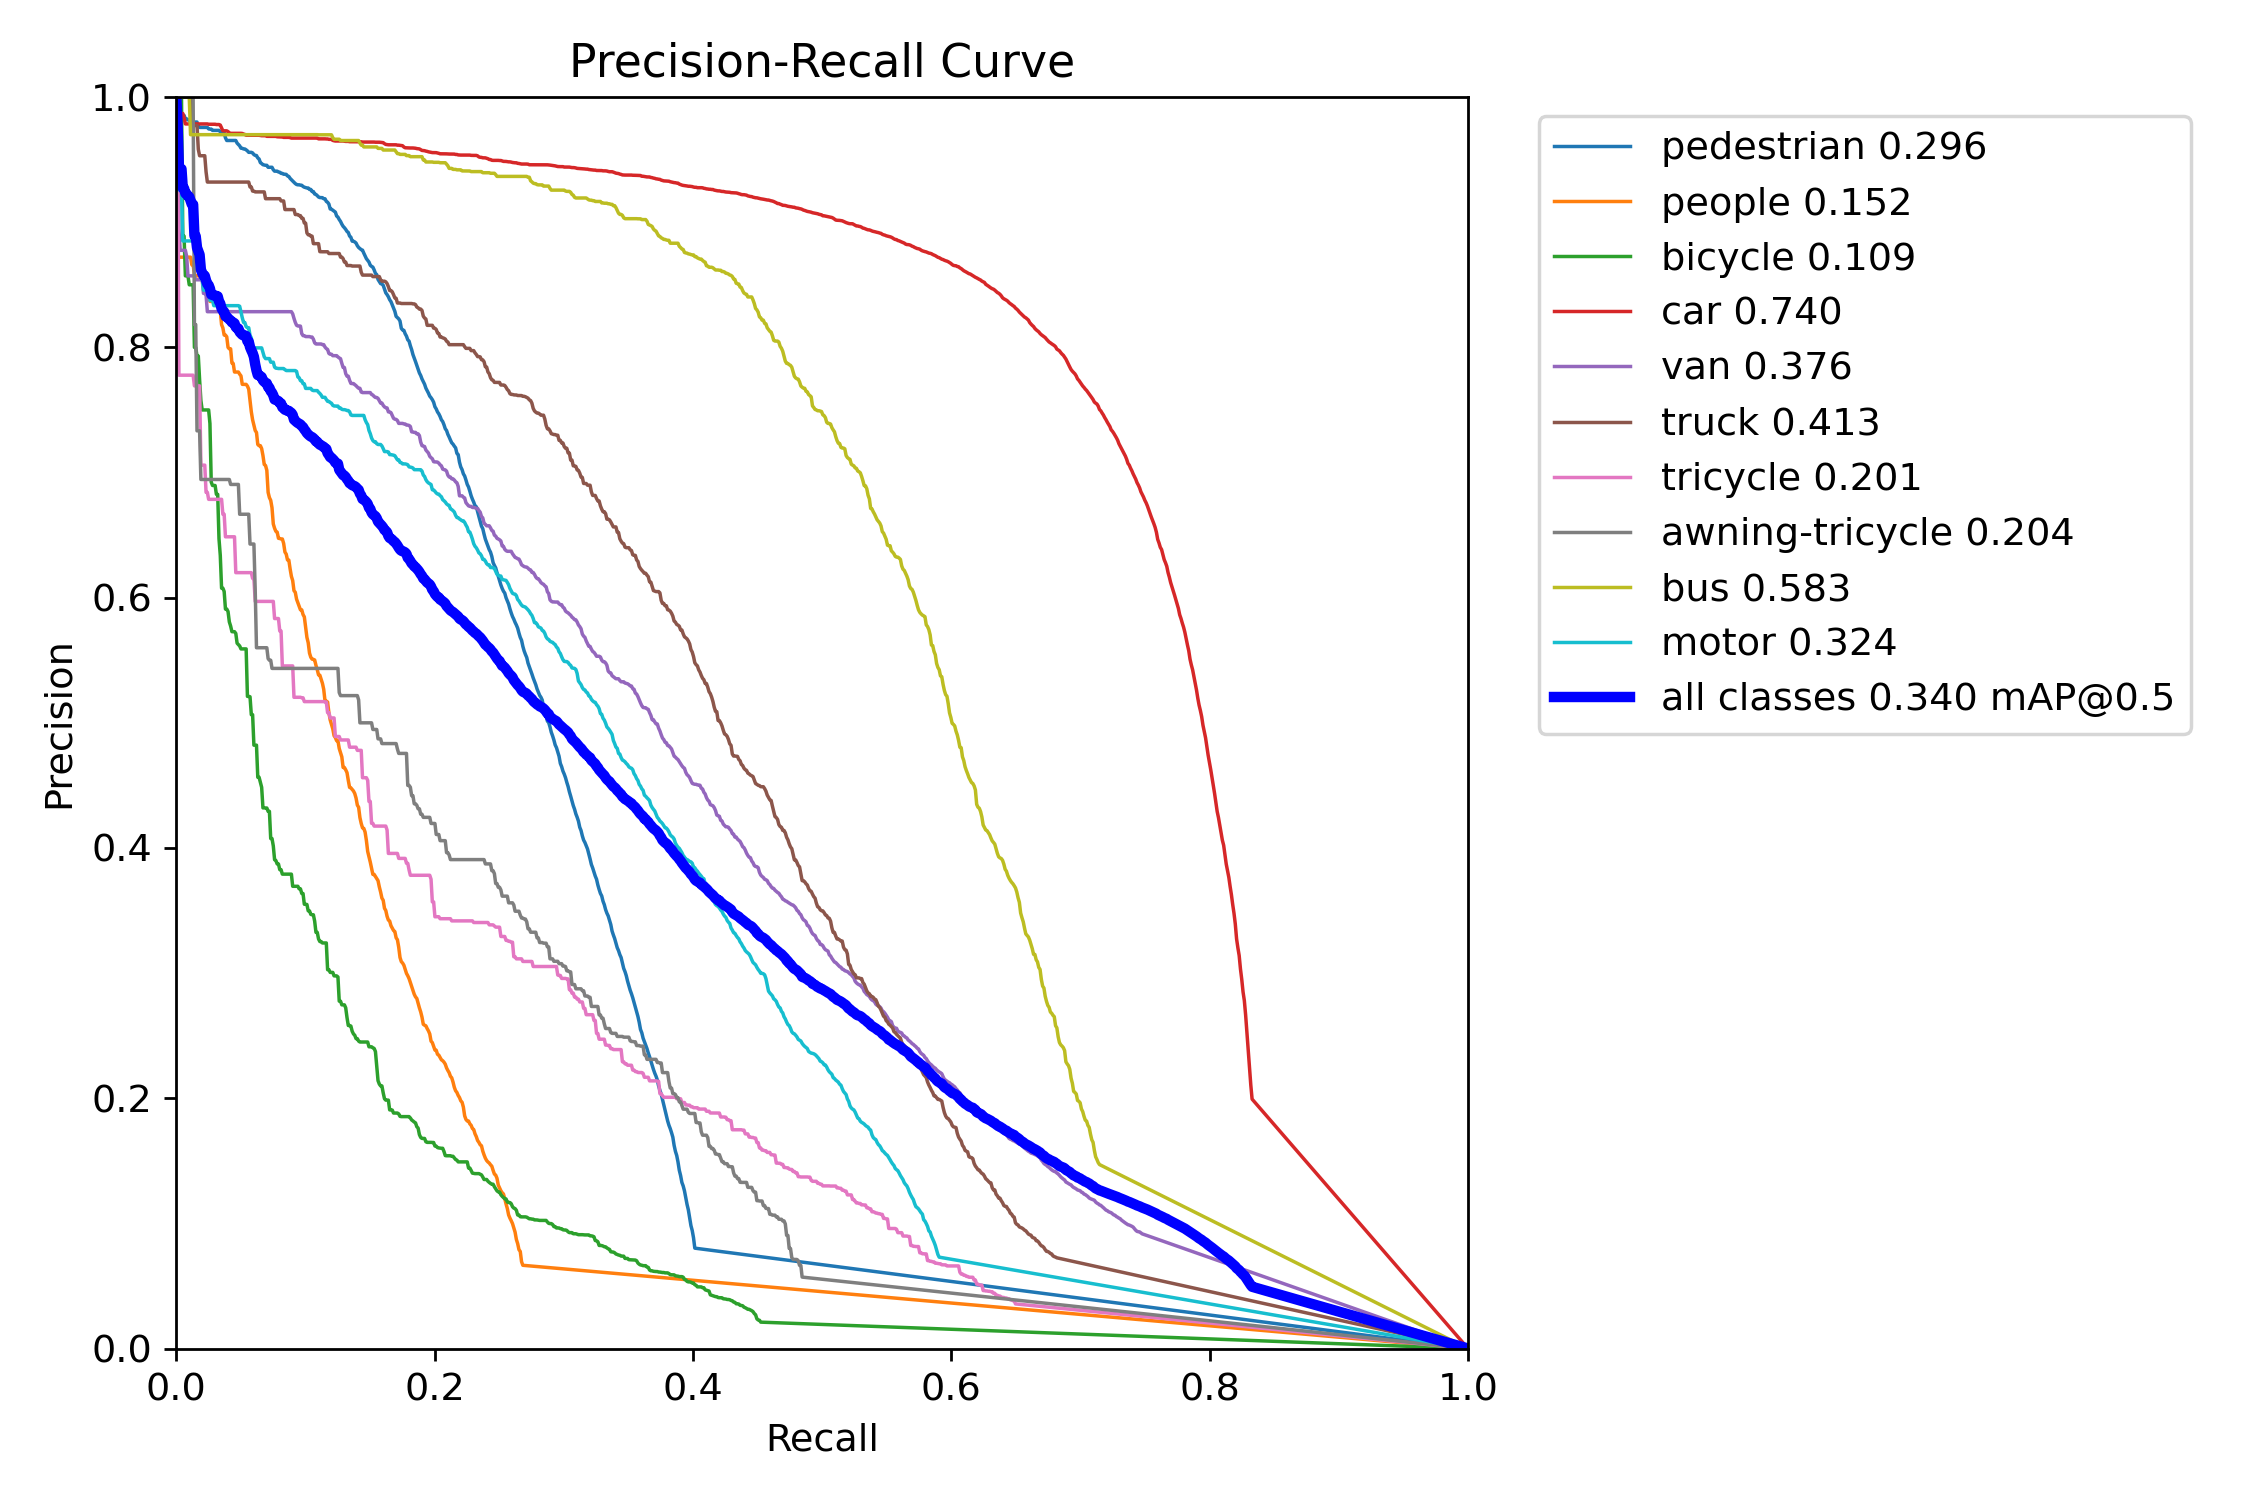
Figure 8 – YOLOv12s test precision–recall curve
Precision-Recall of Extra-Large Variants (YOLOv11x vs. YOLOv12x)

Figure 9 – YOLOv11x training precision–recall curve
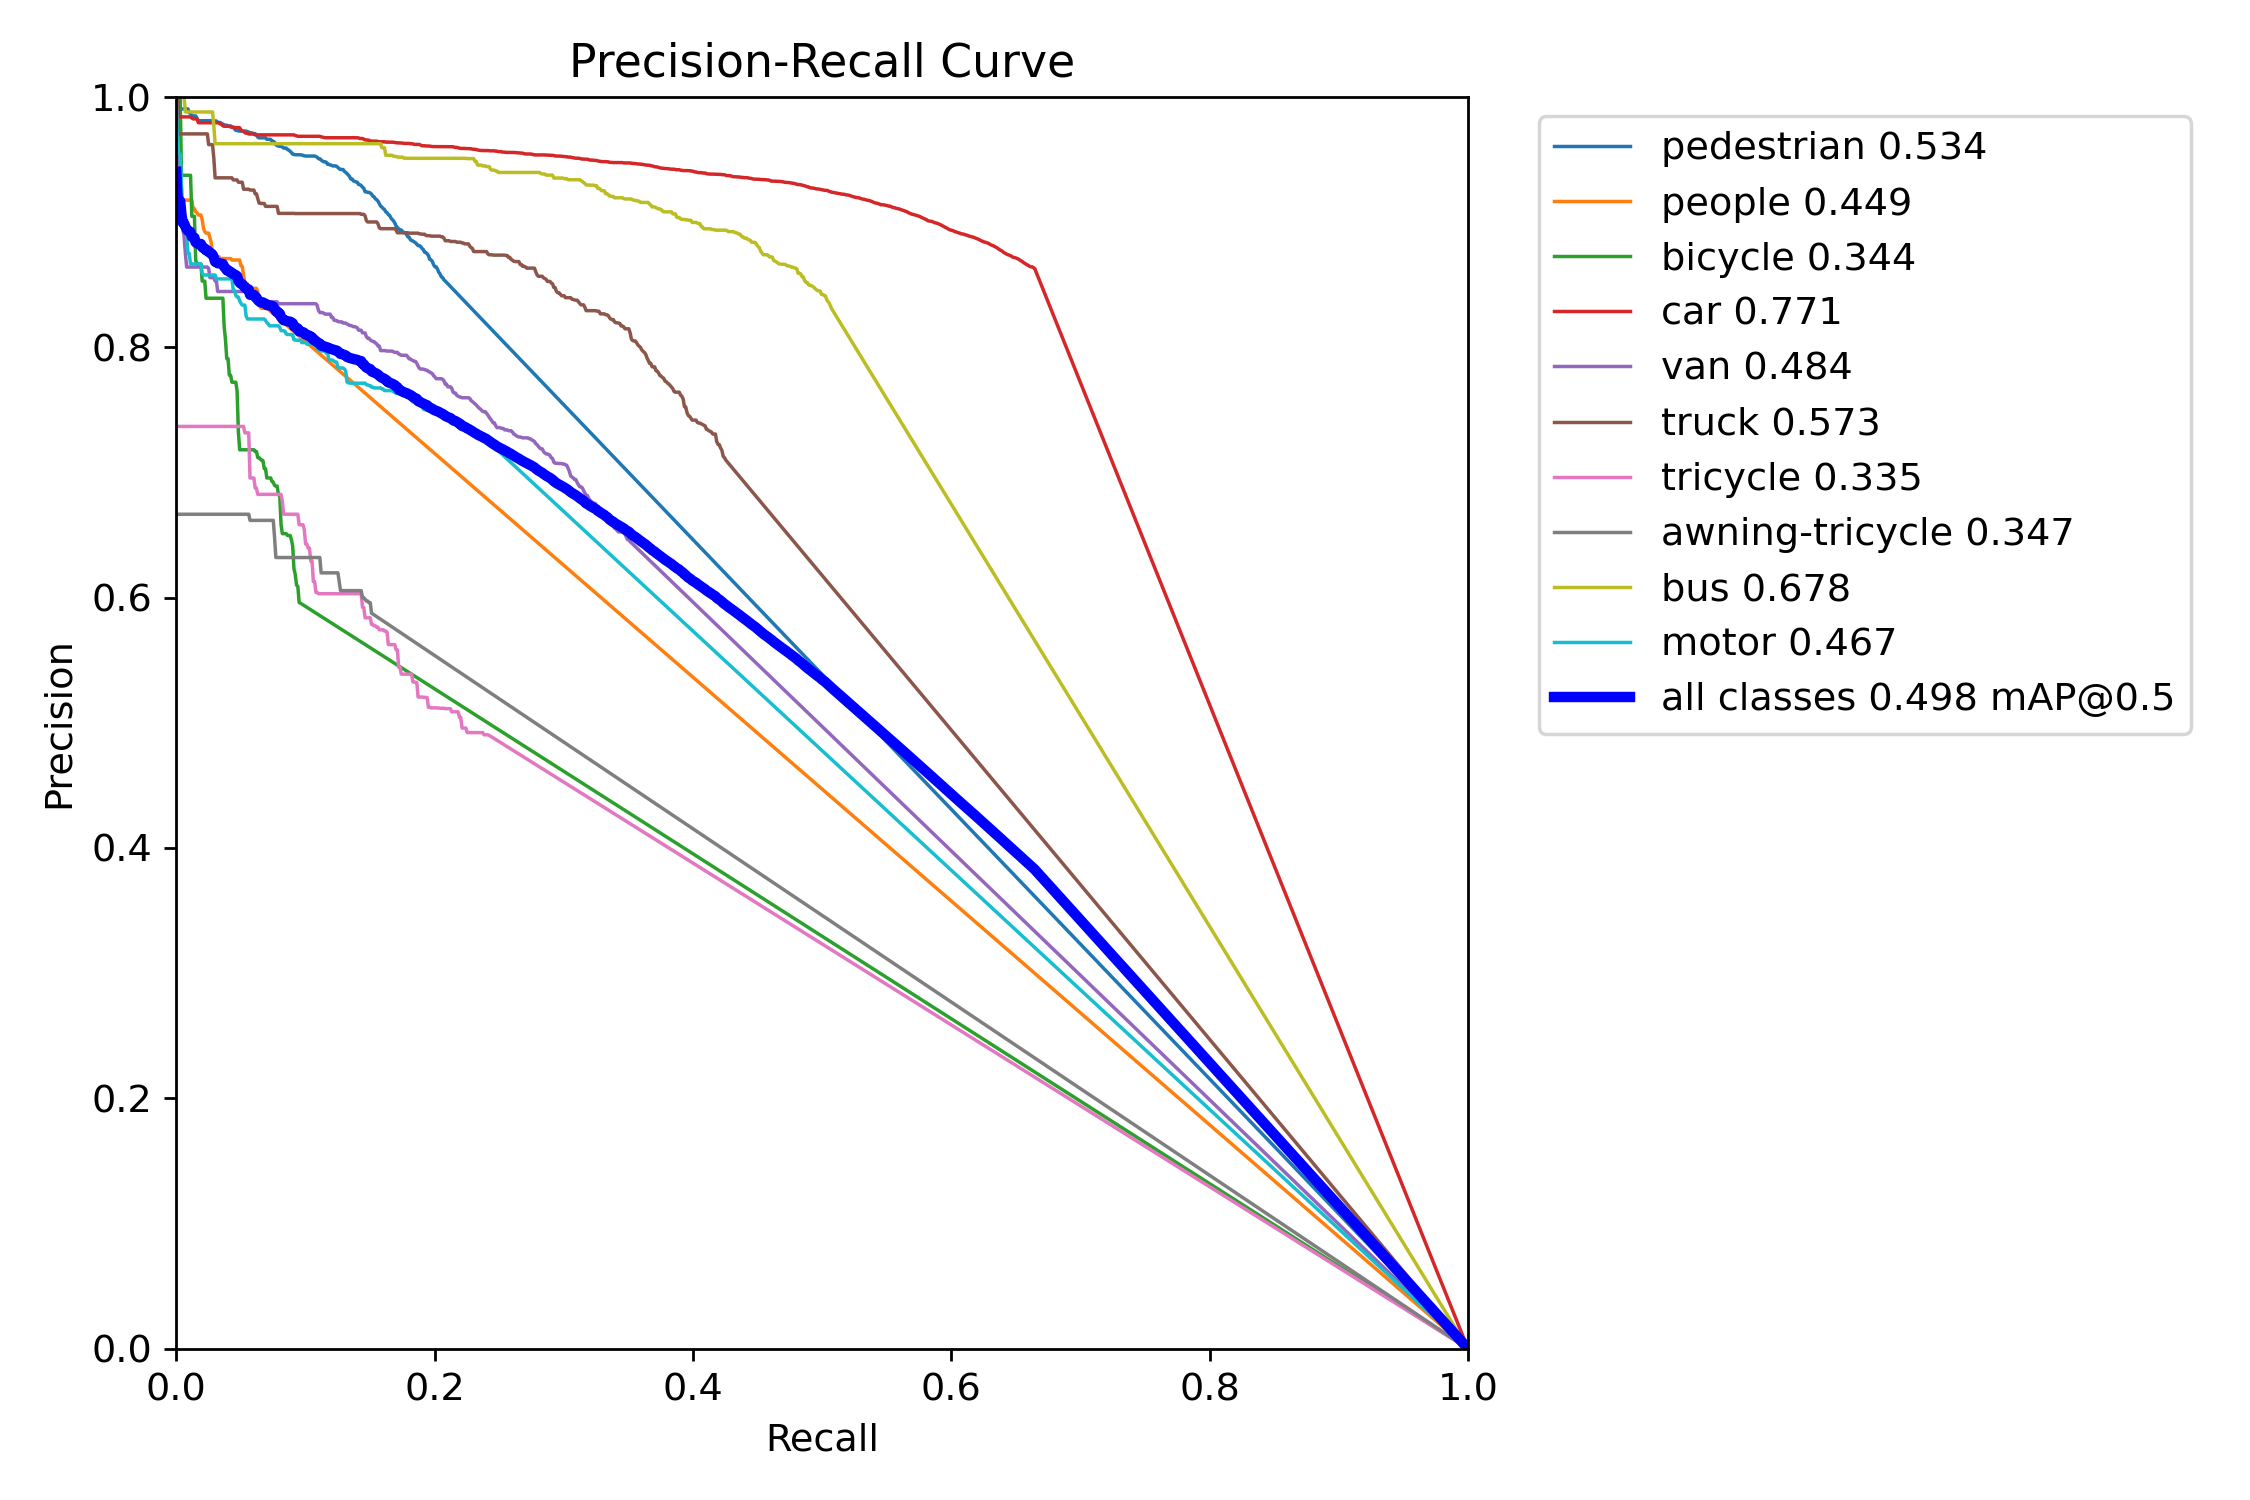
Figure 11 – YOLOv11x test precision–recall curve
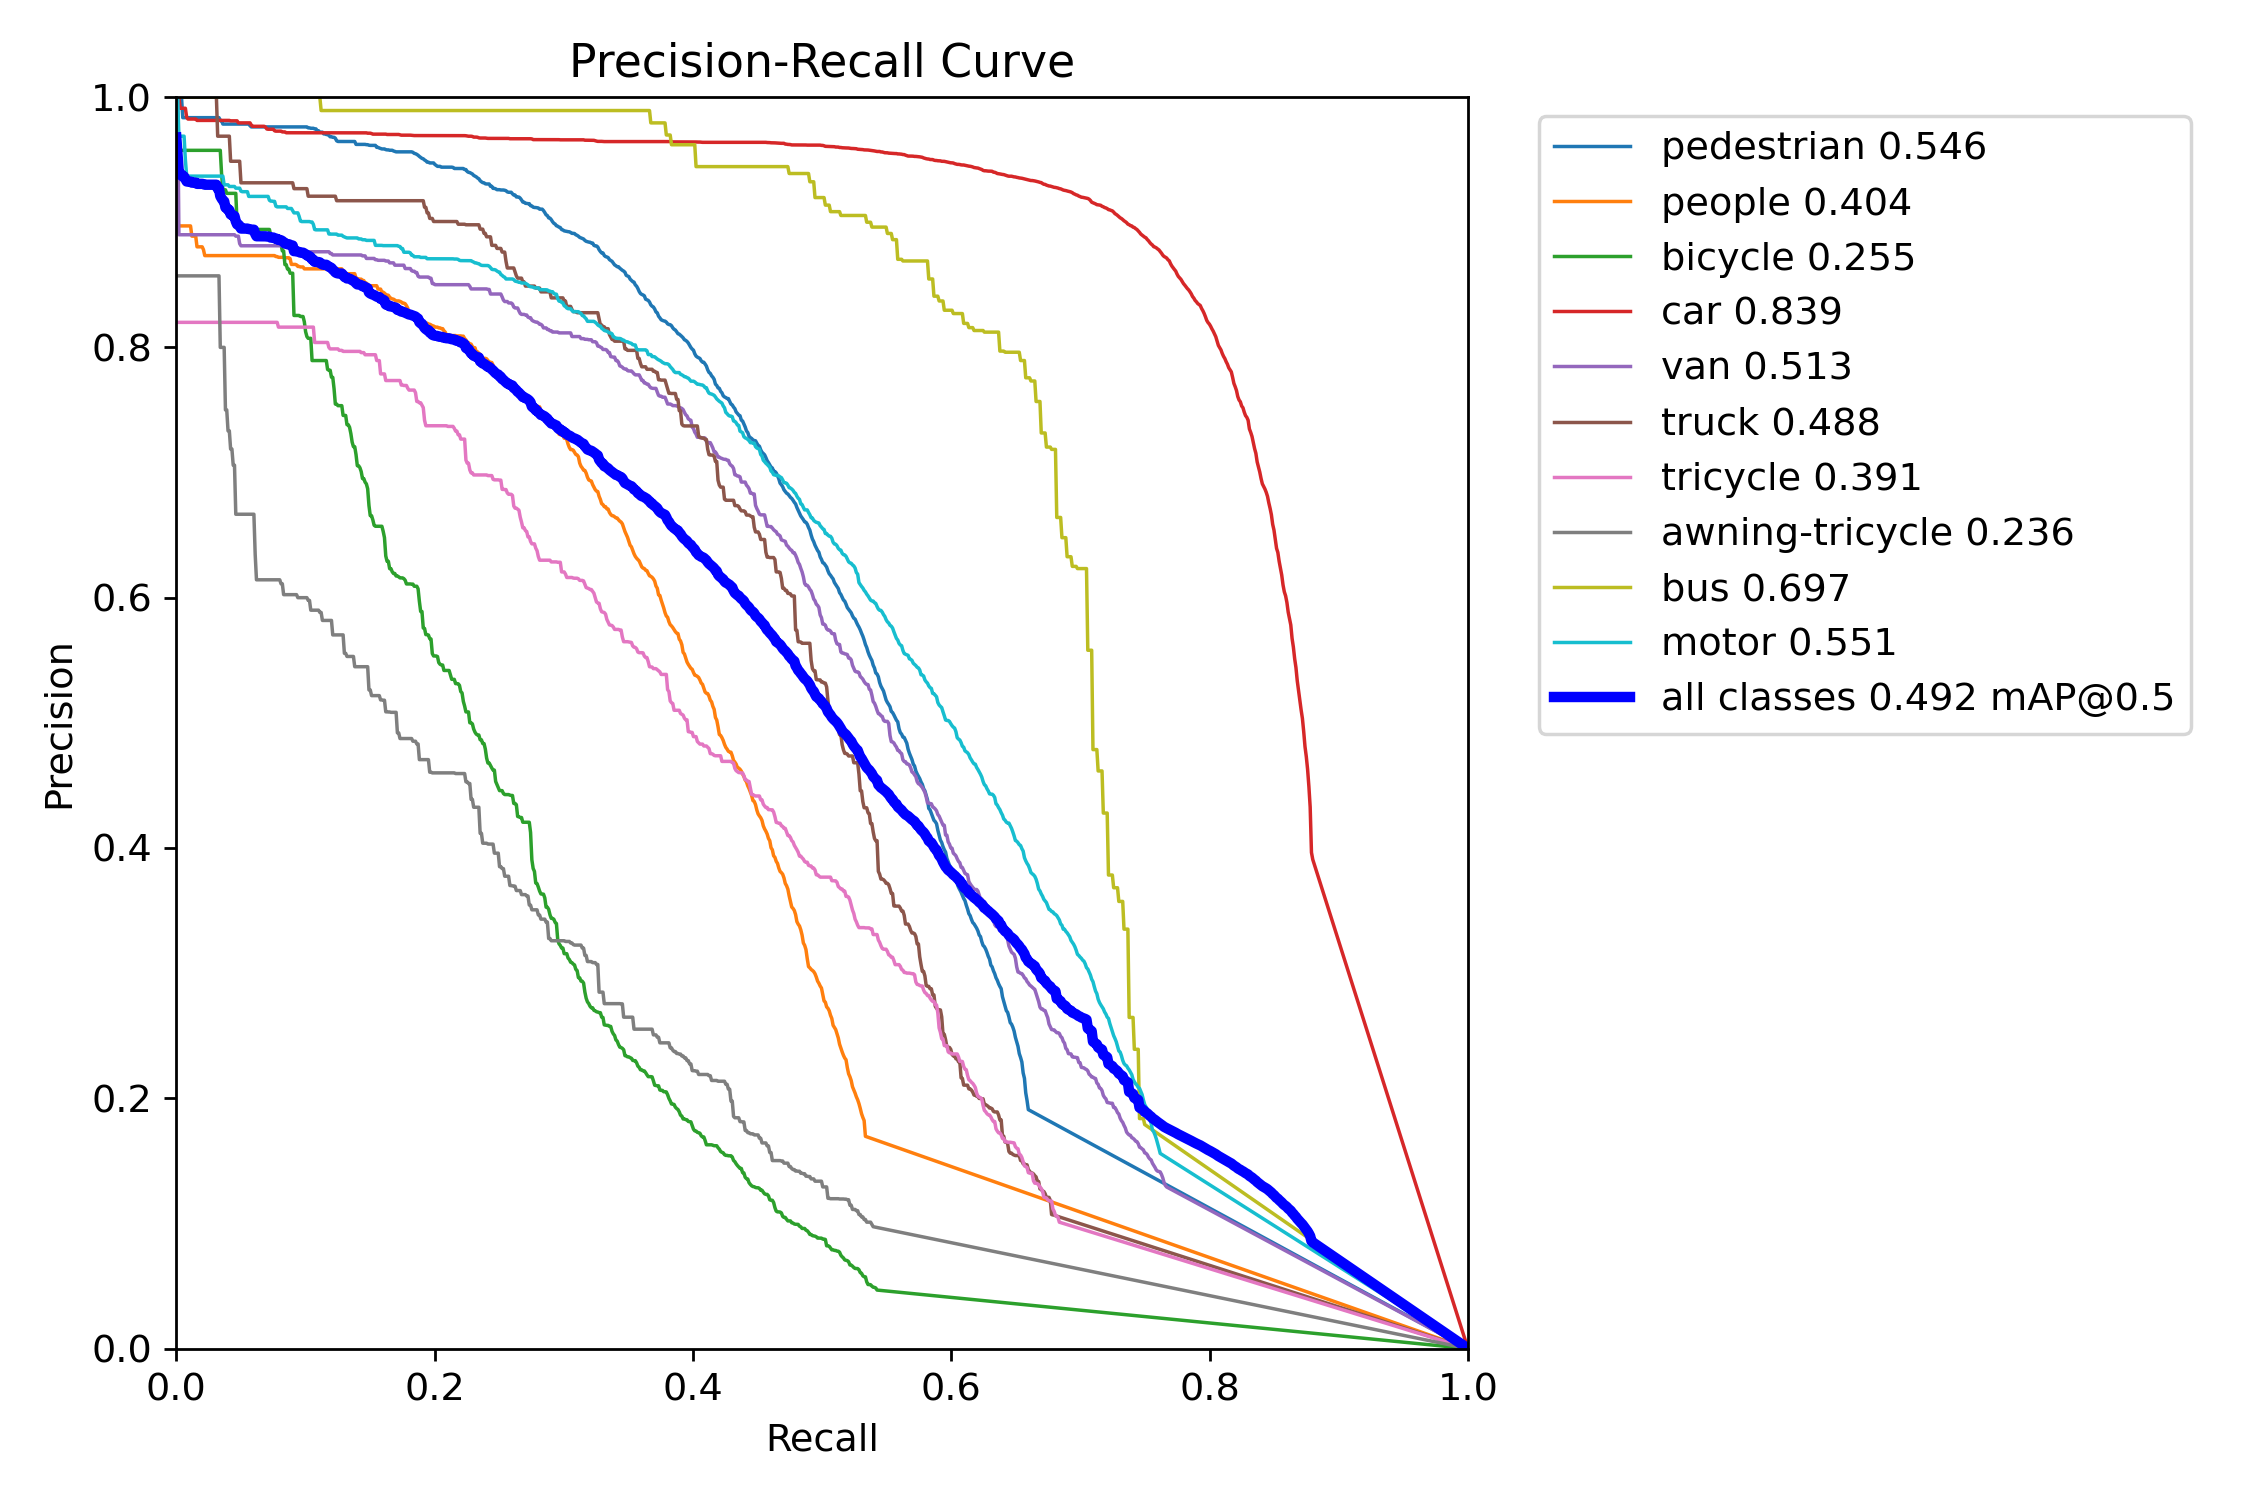
Figure 10 – YOLOv12x training precision–recall curve
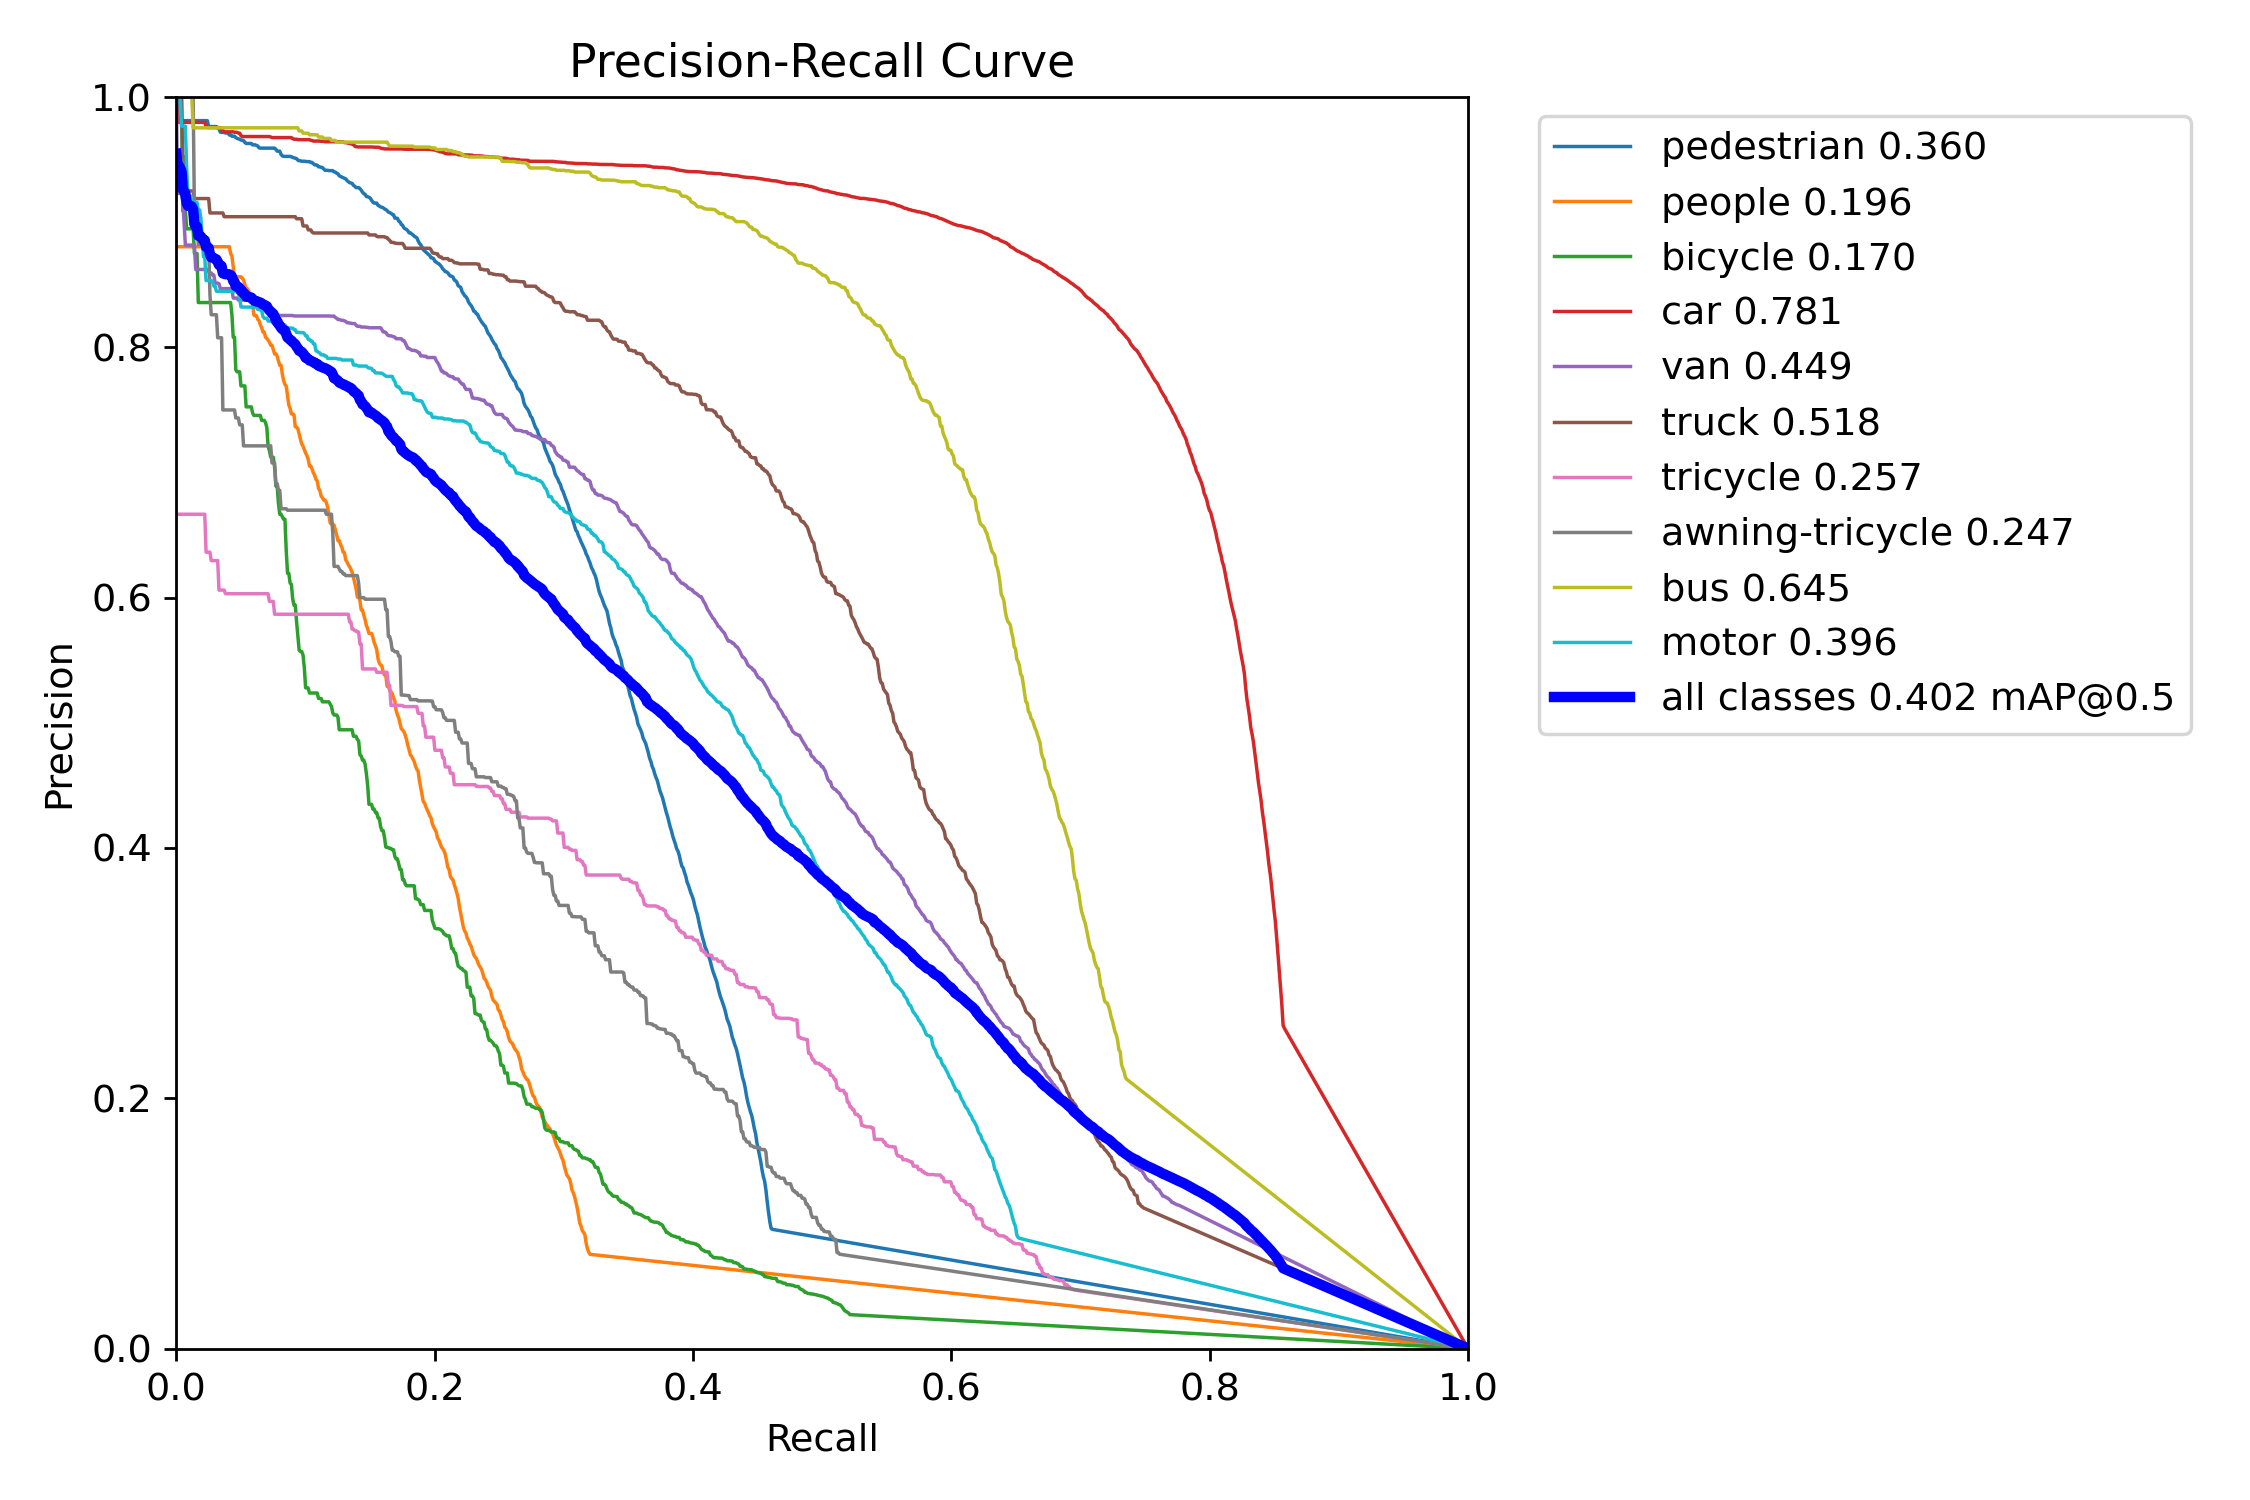
Figure 12 – YOLOv12x test precision–recall curve
Precision–Recall (PR) curves were used to assess detection quality across confidence thresholds. YOLOv11 consistently maintained higher precision at comparable recall levels in both the “s” and “x” tiers. YOLOv11s experienced only a ~6-point drop in mAP when shifting from COCO to VisDrone, while YOLOv12s lost over 16 points—indicating weaker generalization. YOLOv11x similarly outperformed YOLOv12x under occlusion-heavy, small-object test conditions.
f-1 Confidence
F-1 Confidence of Small Variants (YOLOv11s vs. YOLOv12s):
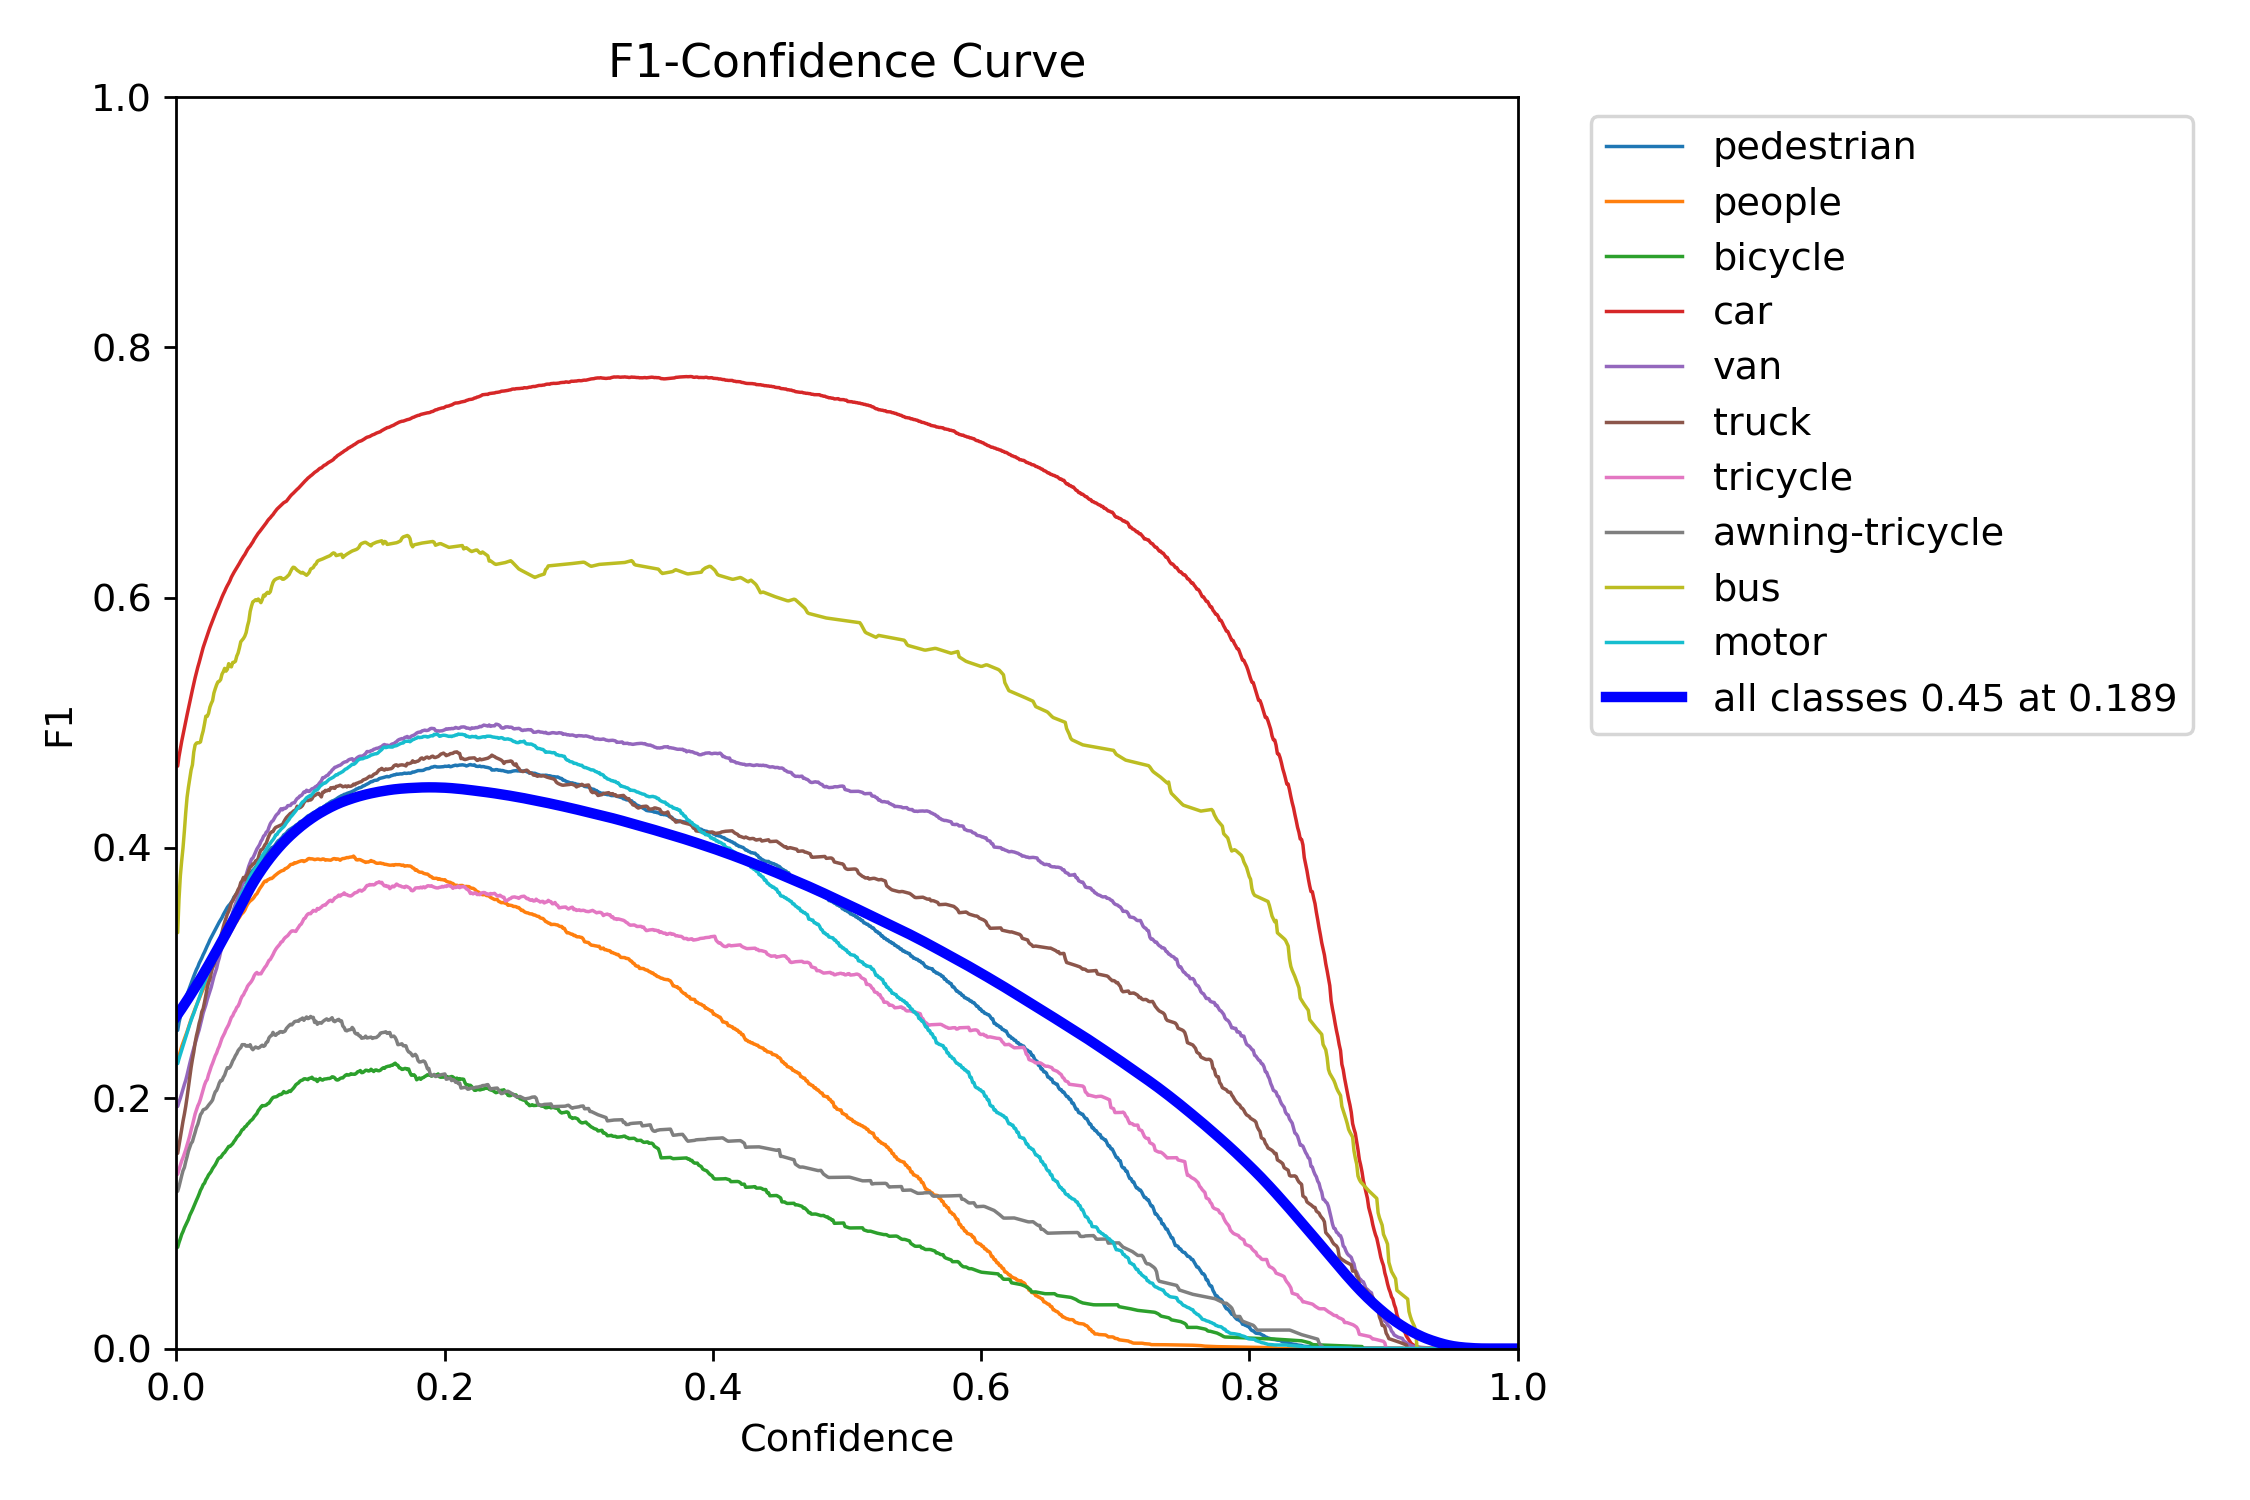
Figure 13 – YOLOv11s training F1–confidence curve
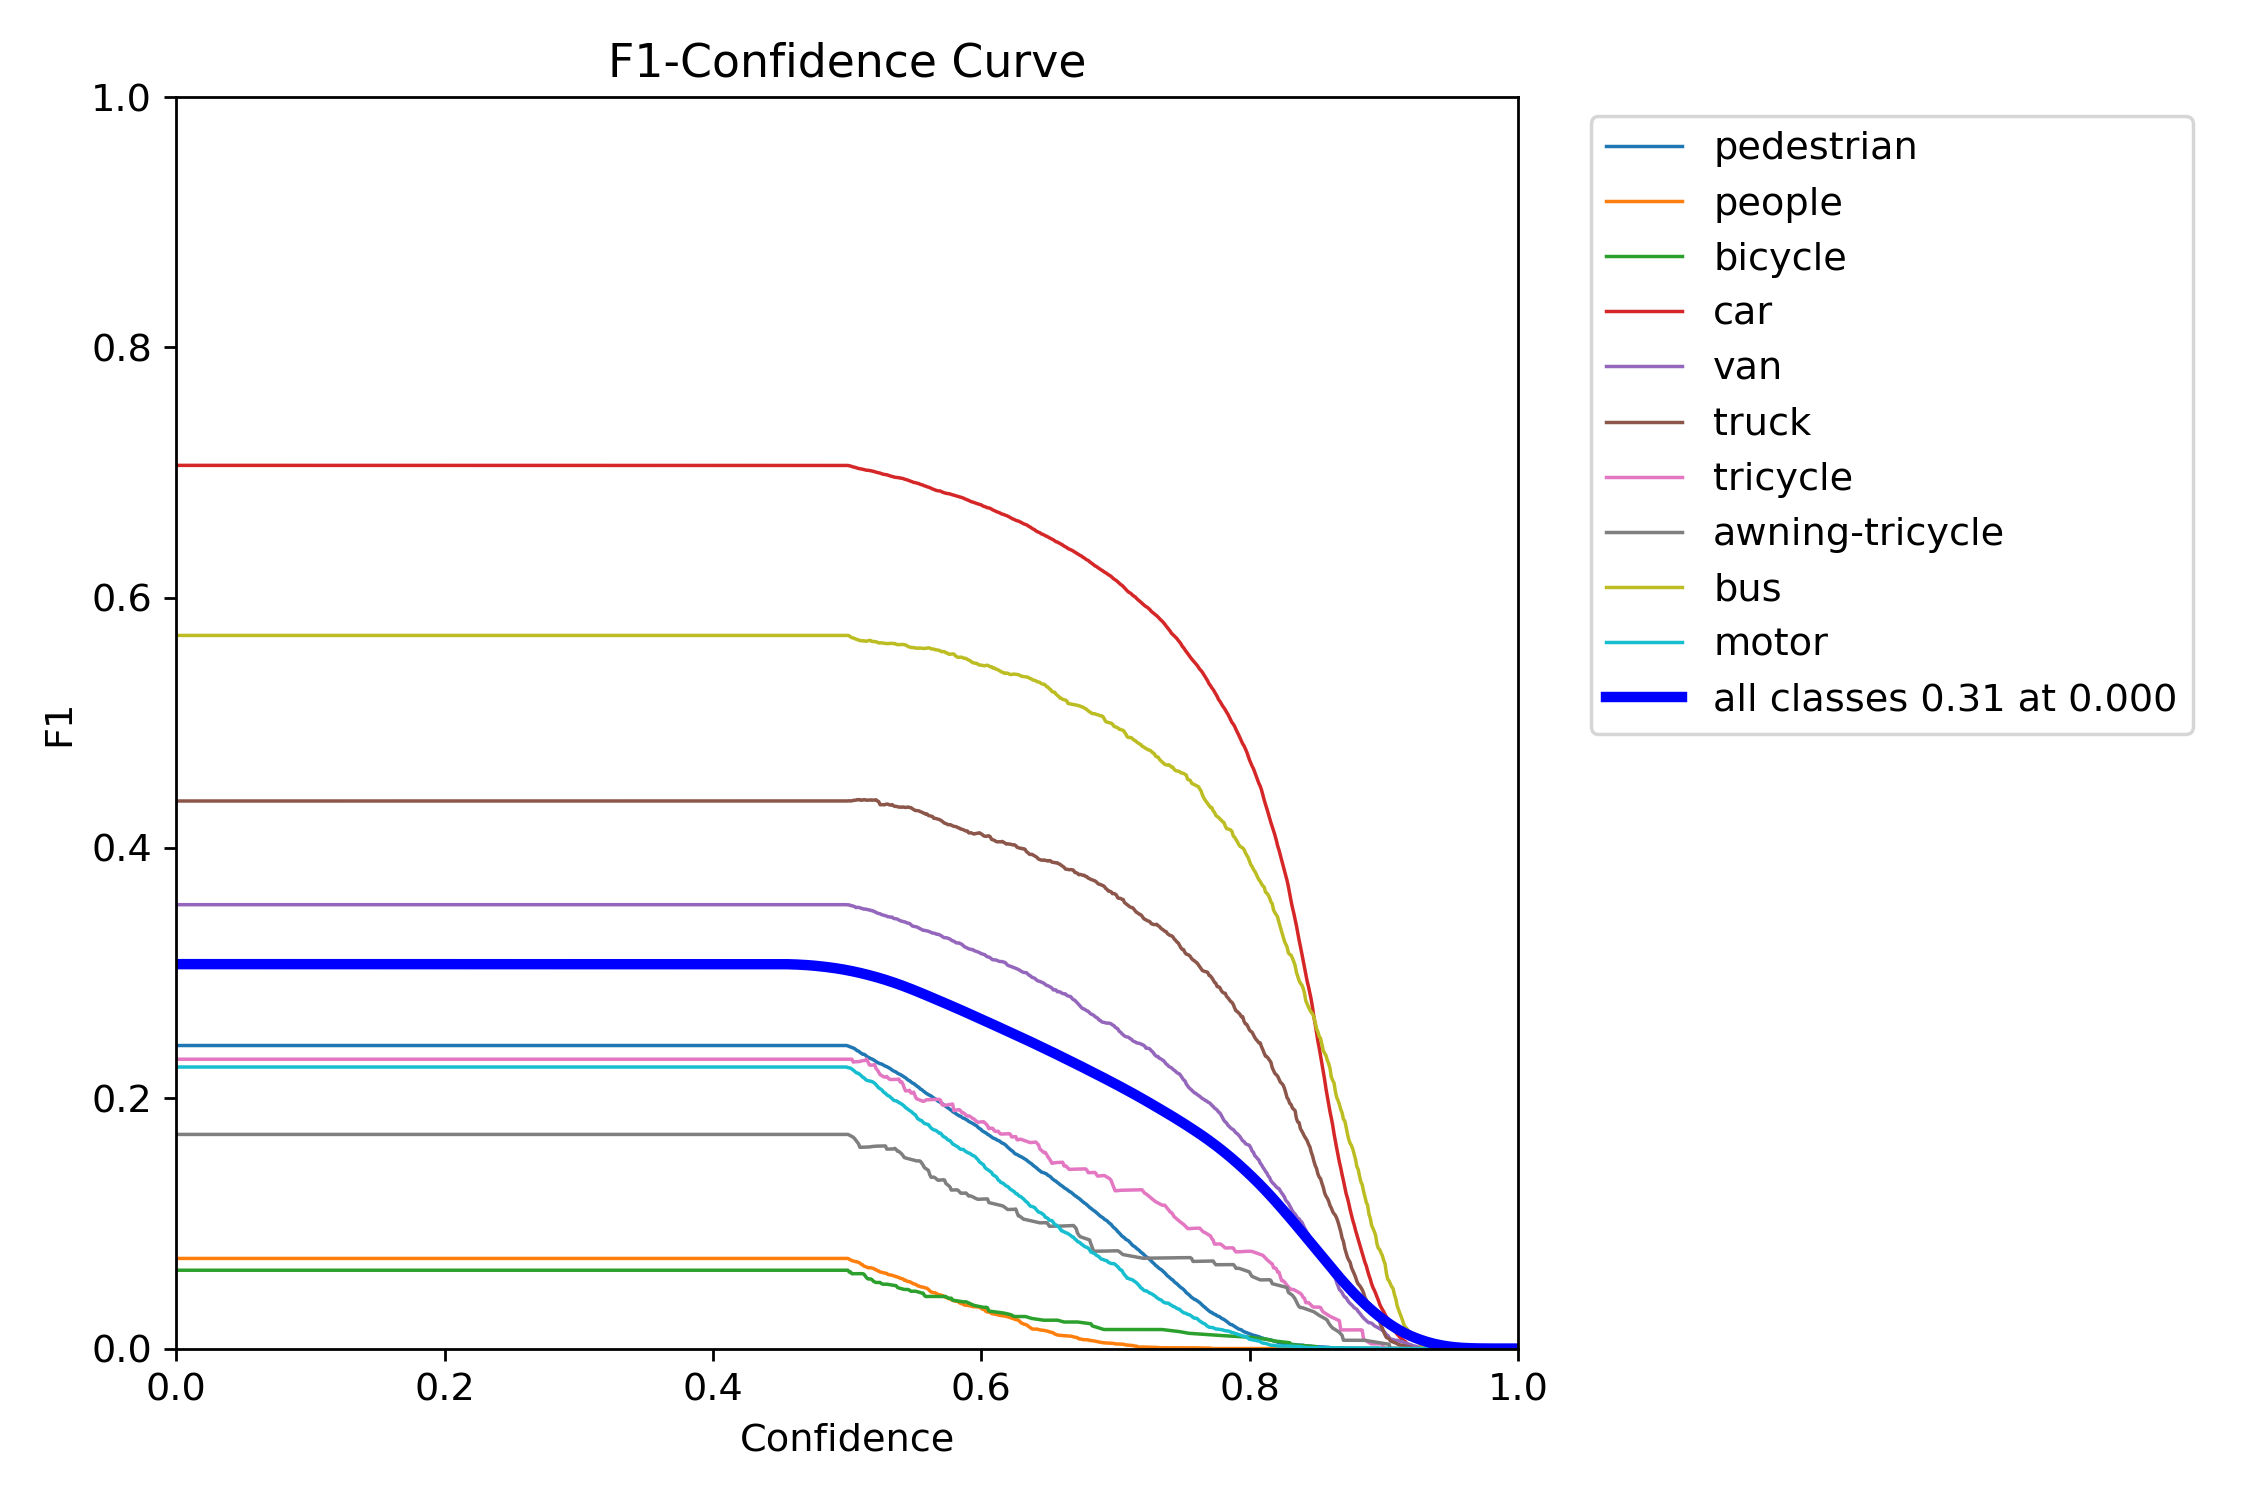
Figure 15 – YOLOv11s test F1–confidence curve
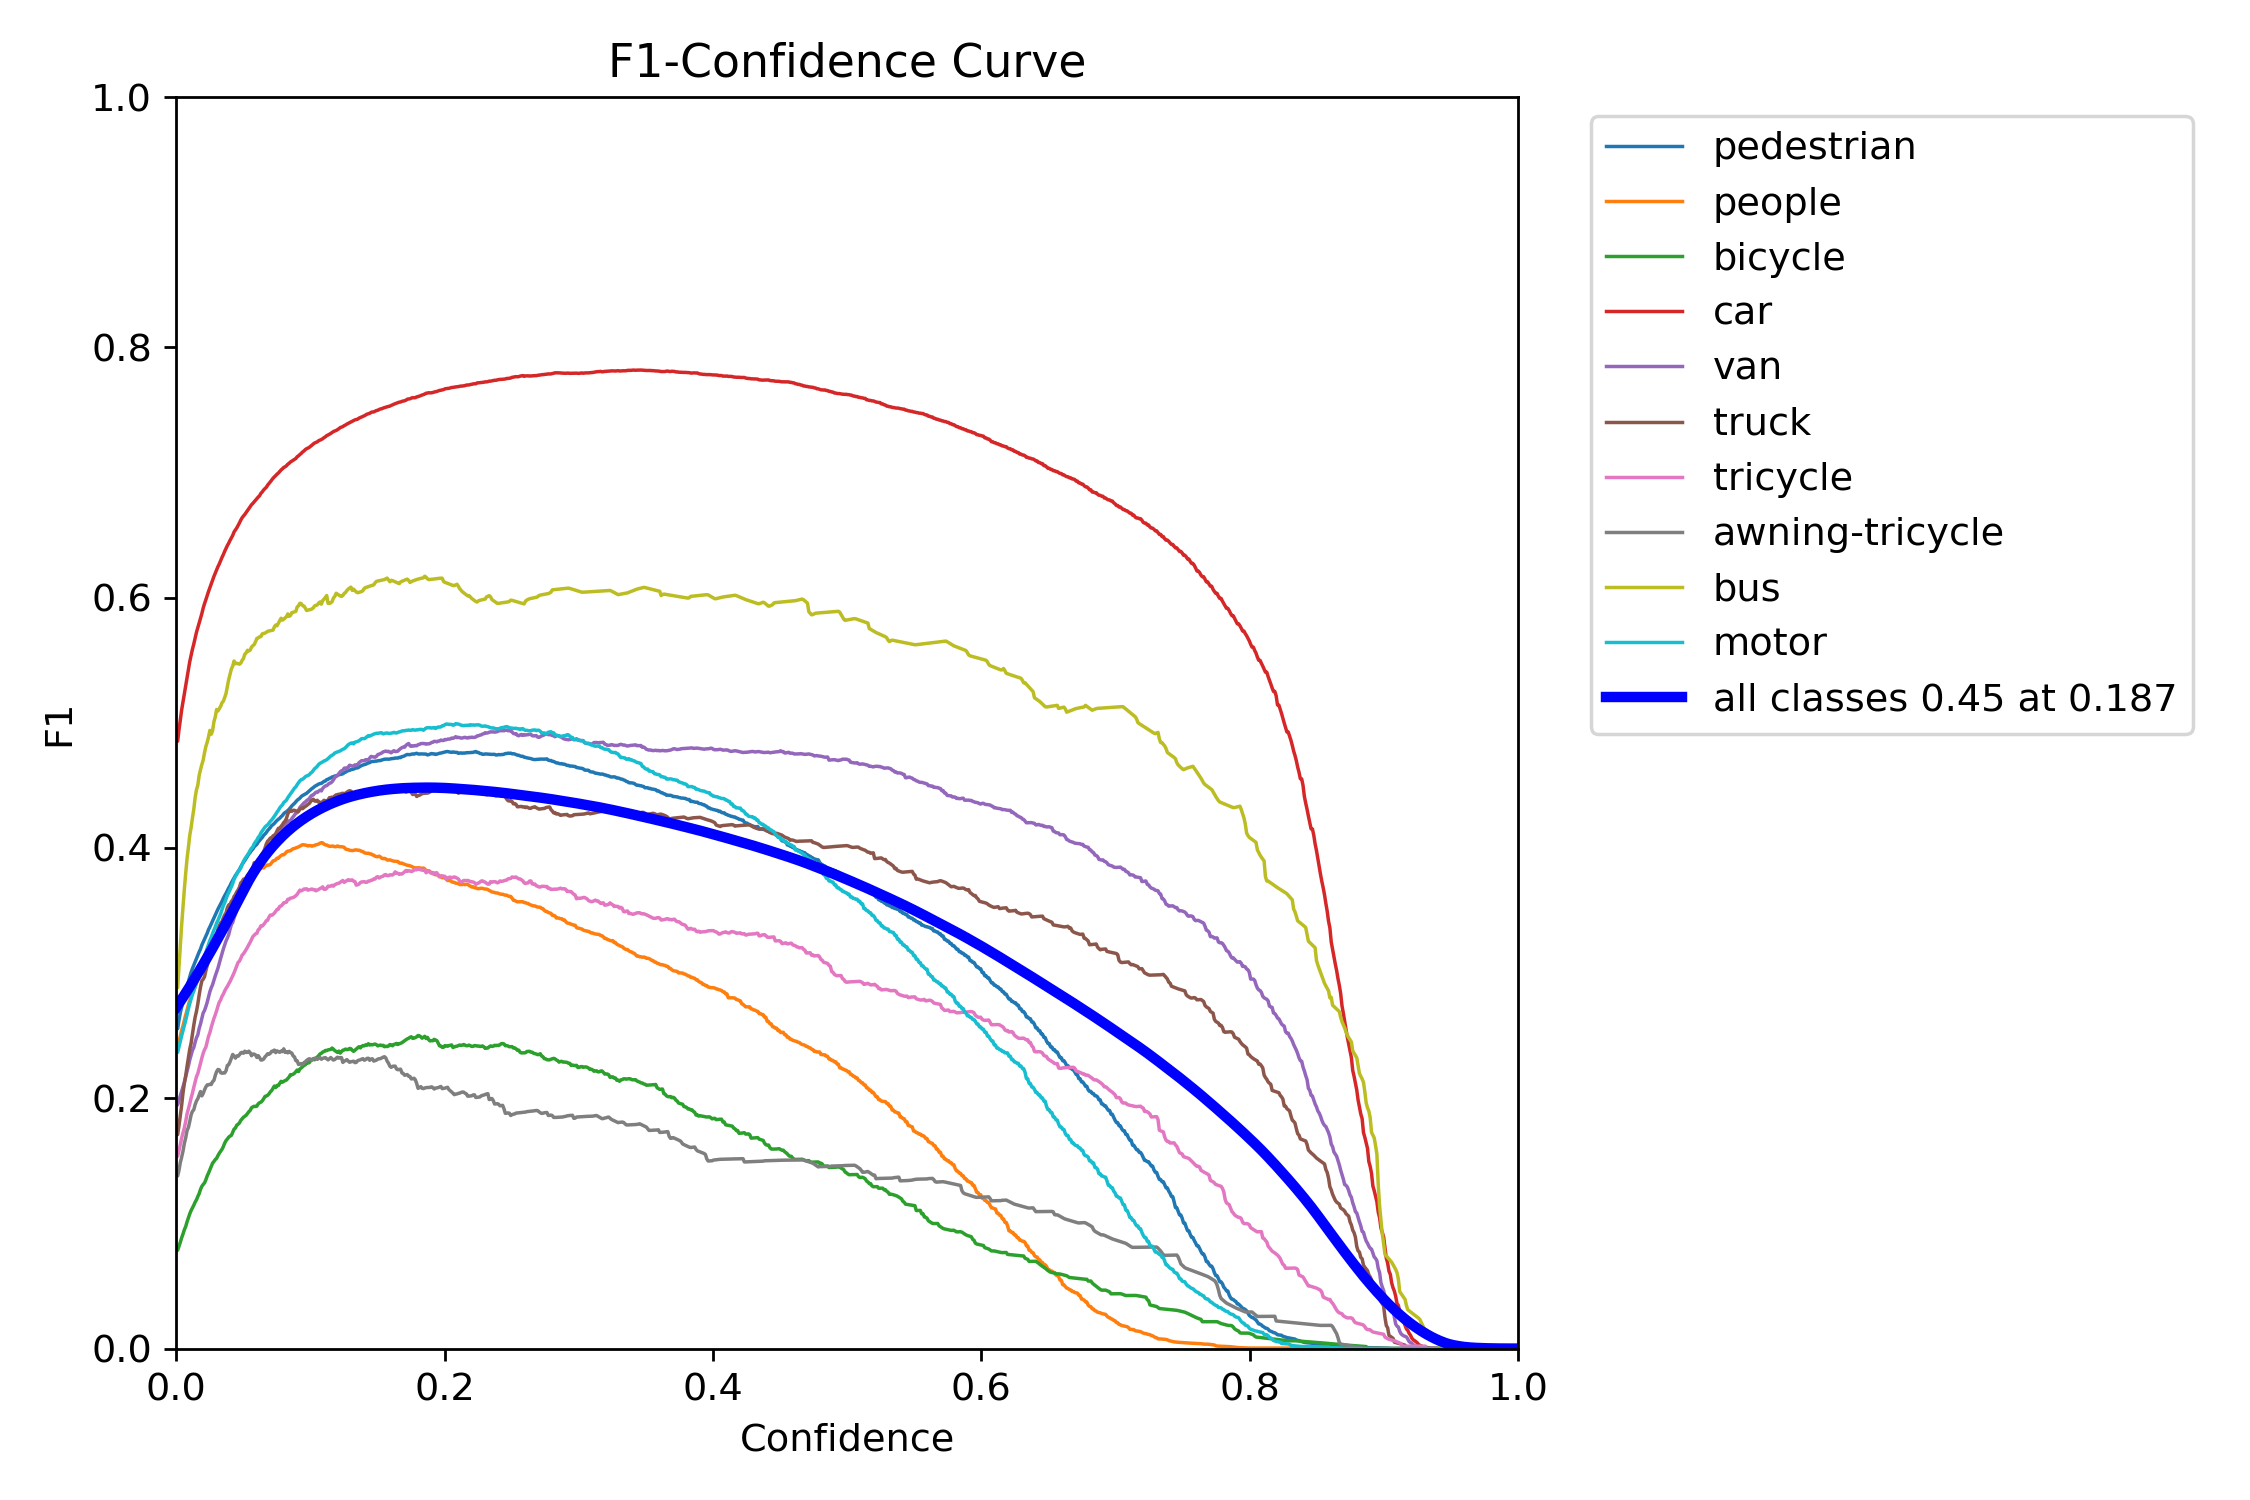
Figure 14 – YOLOv12s training F1–confidence curve
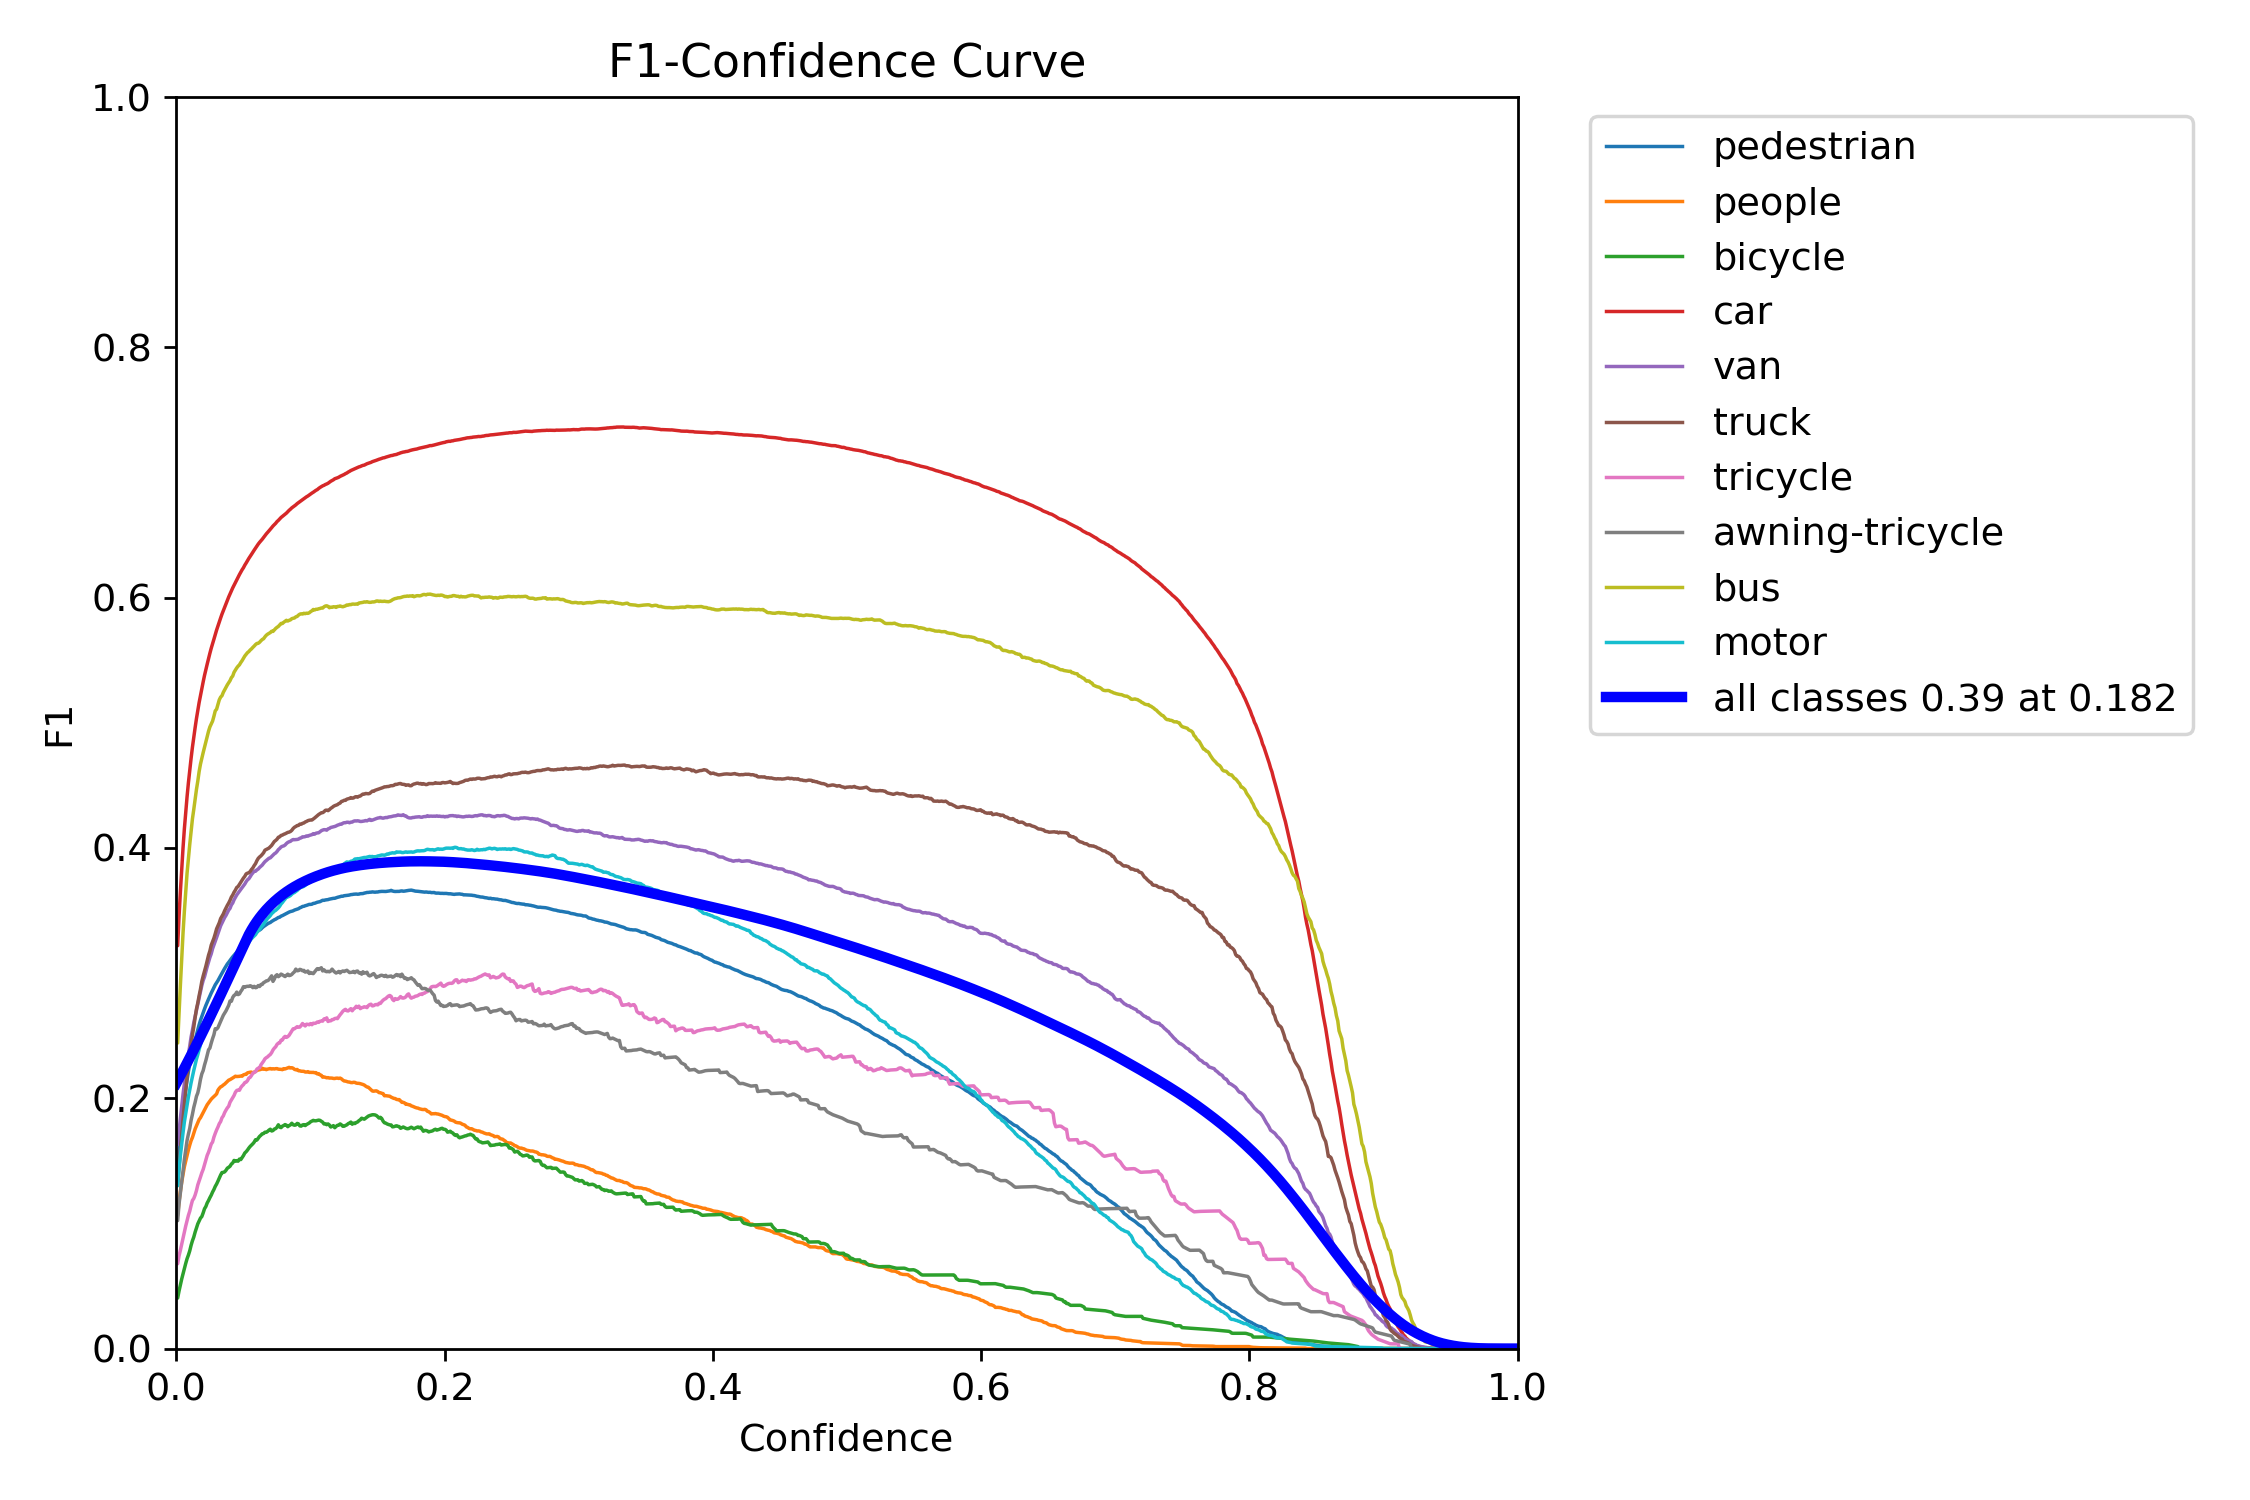
Figure 16 – YOLOv12s test F1–confidence curve
F-1 Confidence of Extra-Large Variants (YOLOv11x vs. YOLOv12x)
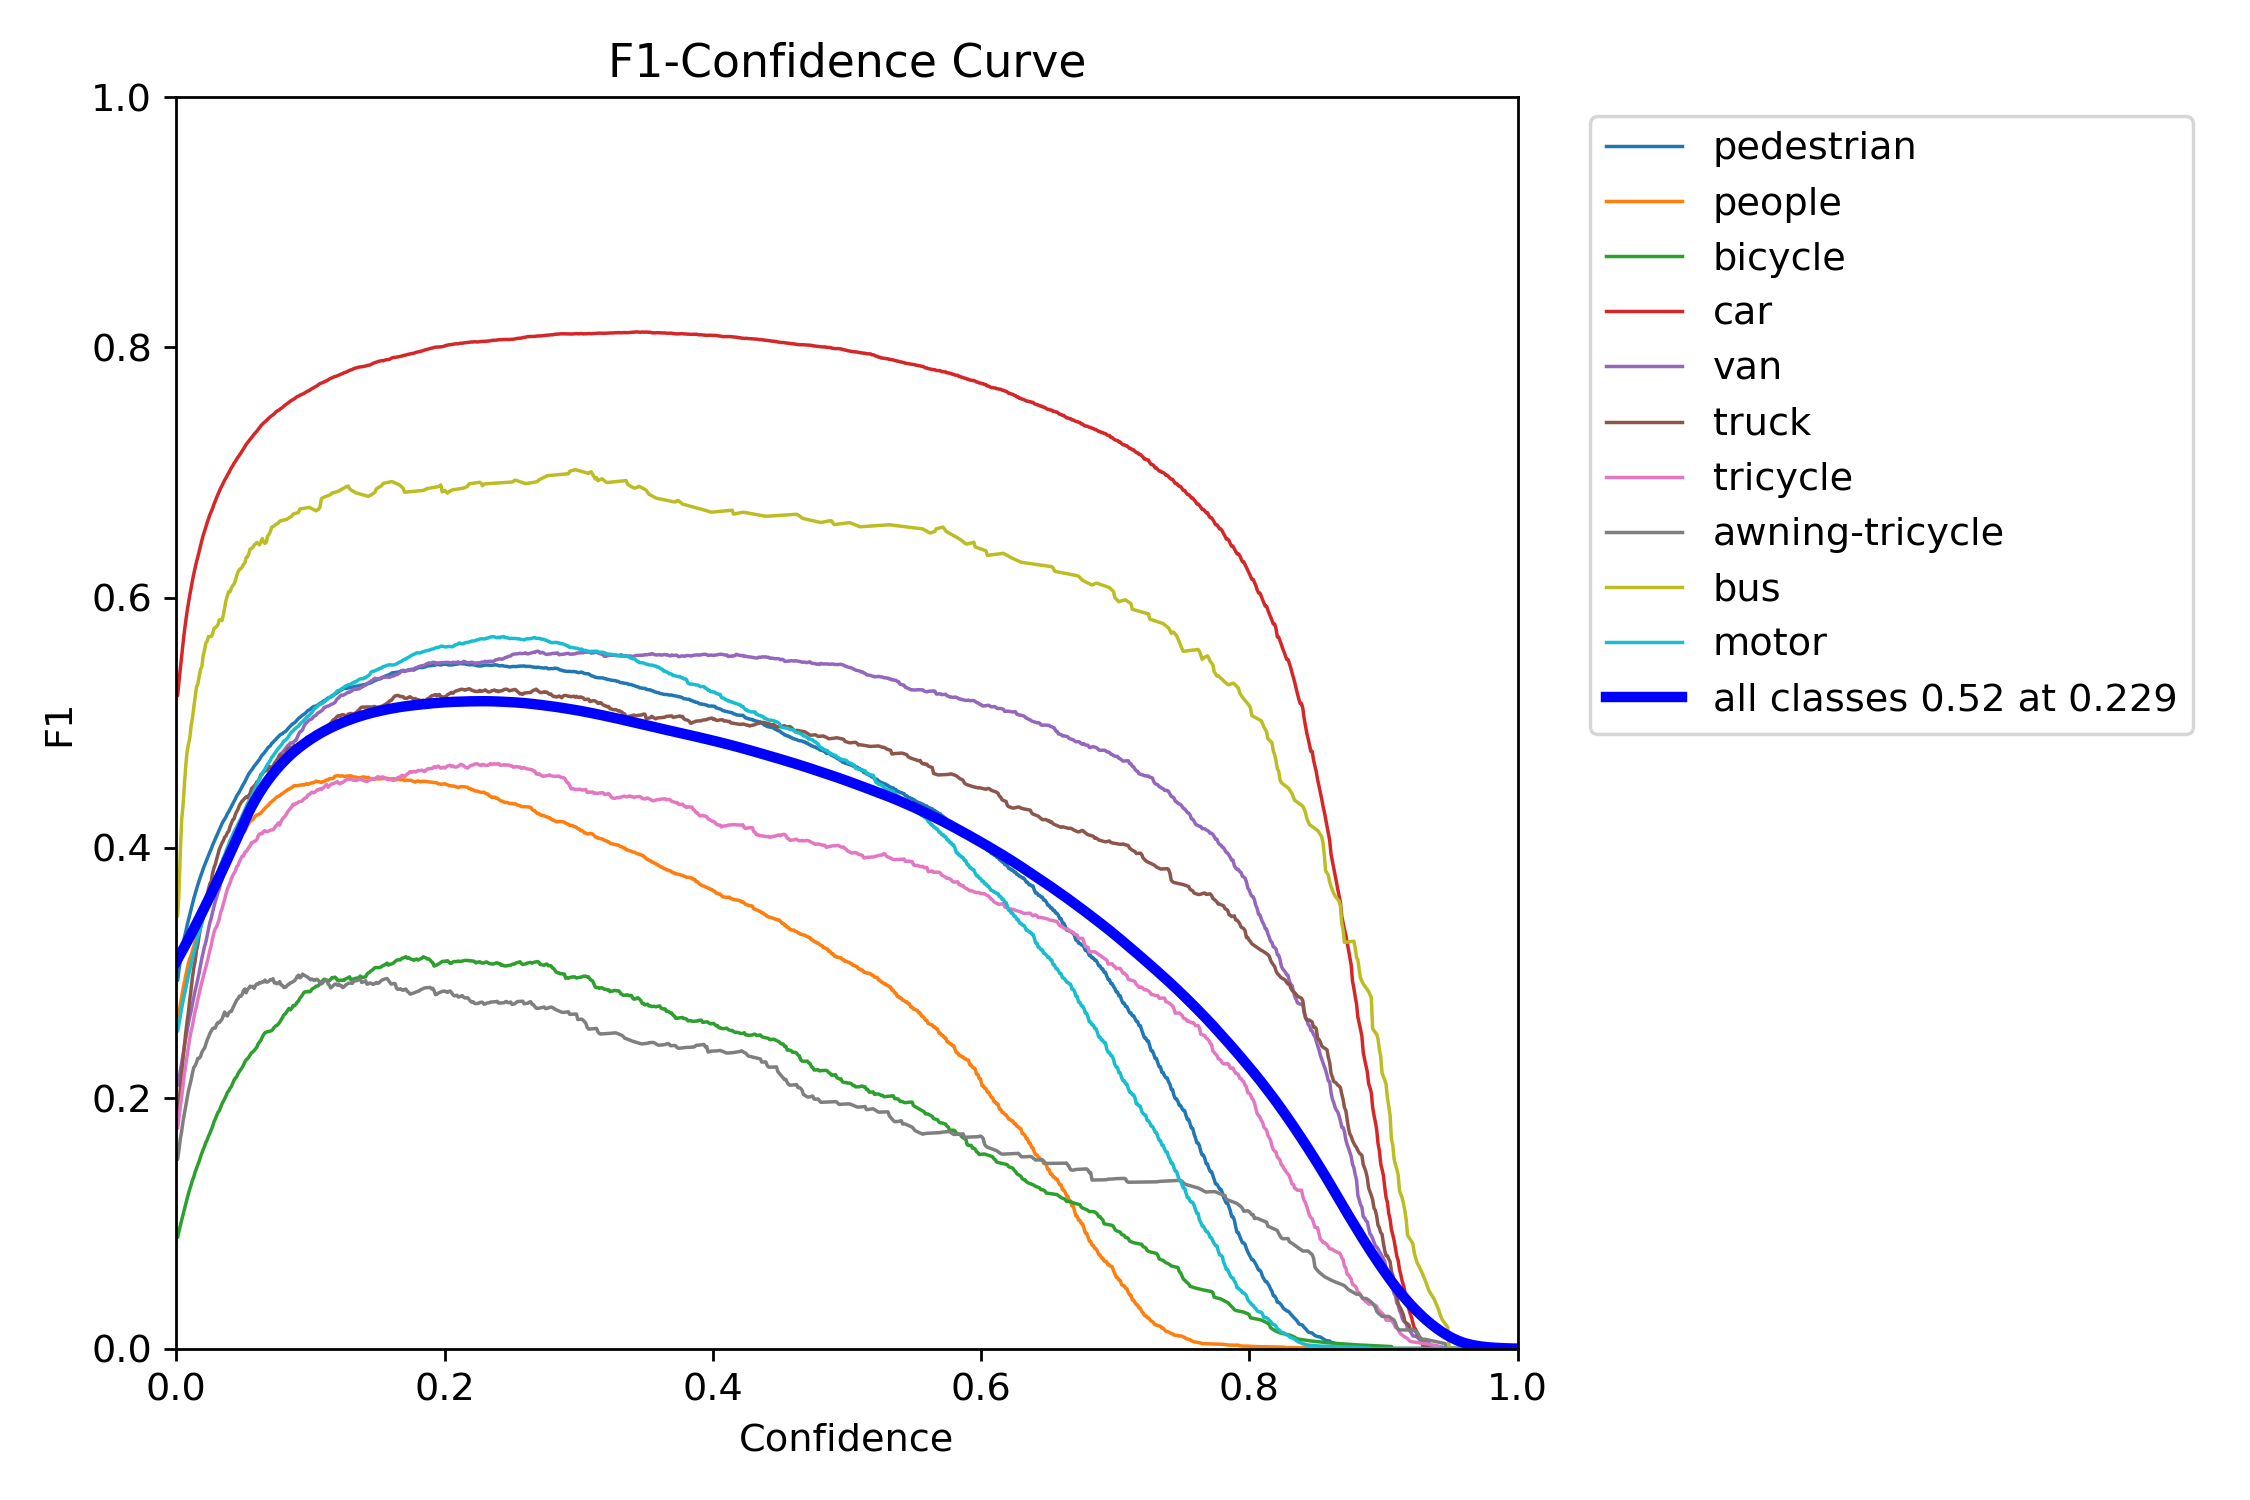
Figure 17 – YOLOv11x training F1–confidence curve
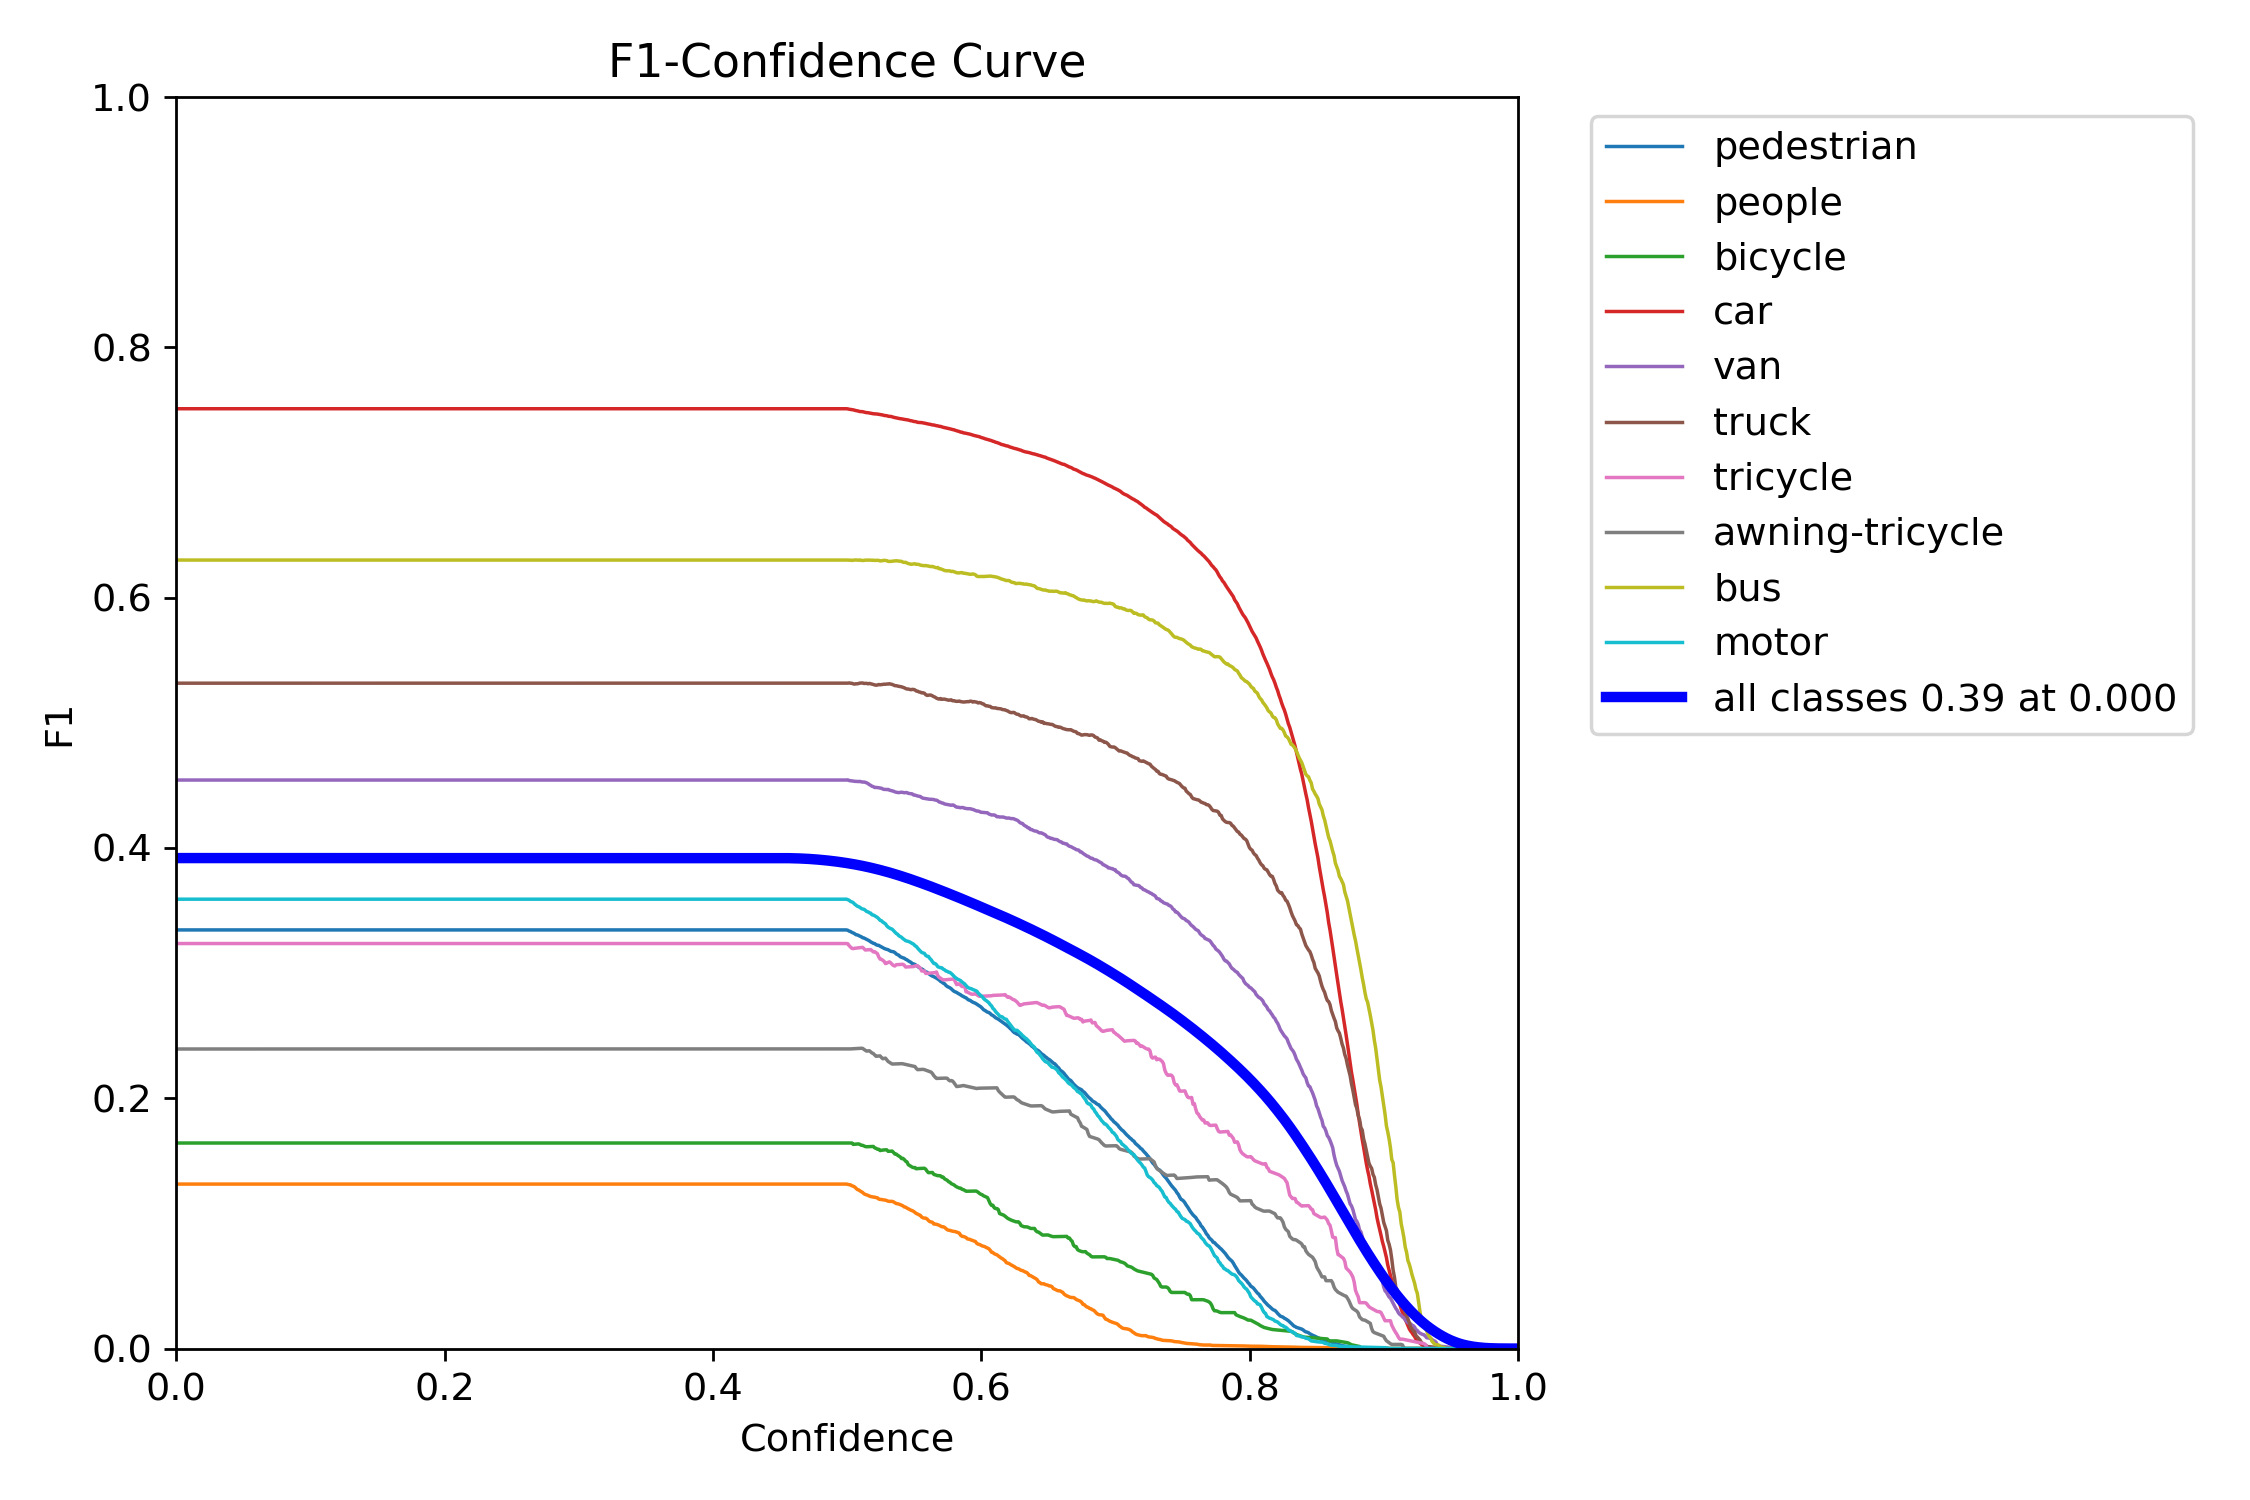
Figure 19 – YOLOv11x test F1–confidence curve
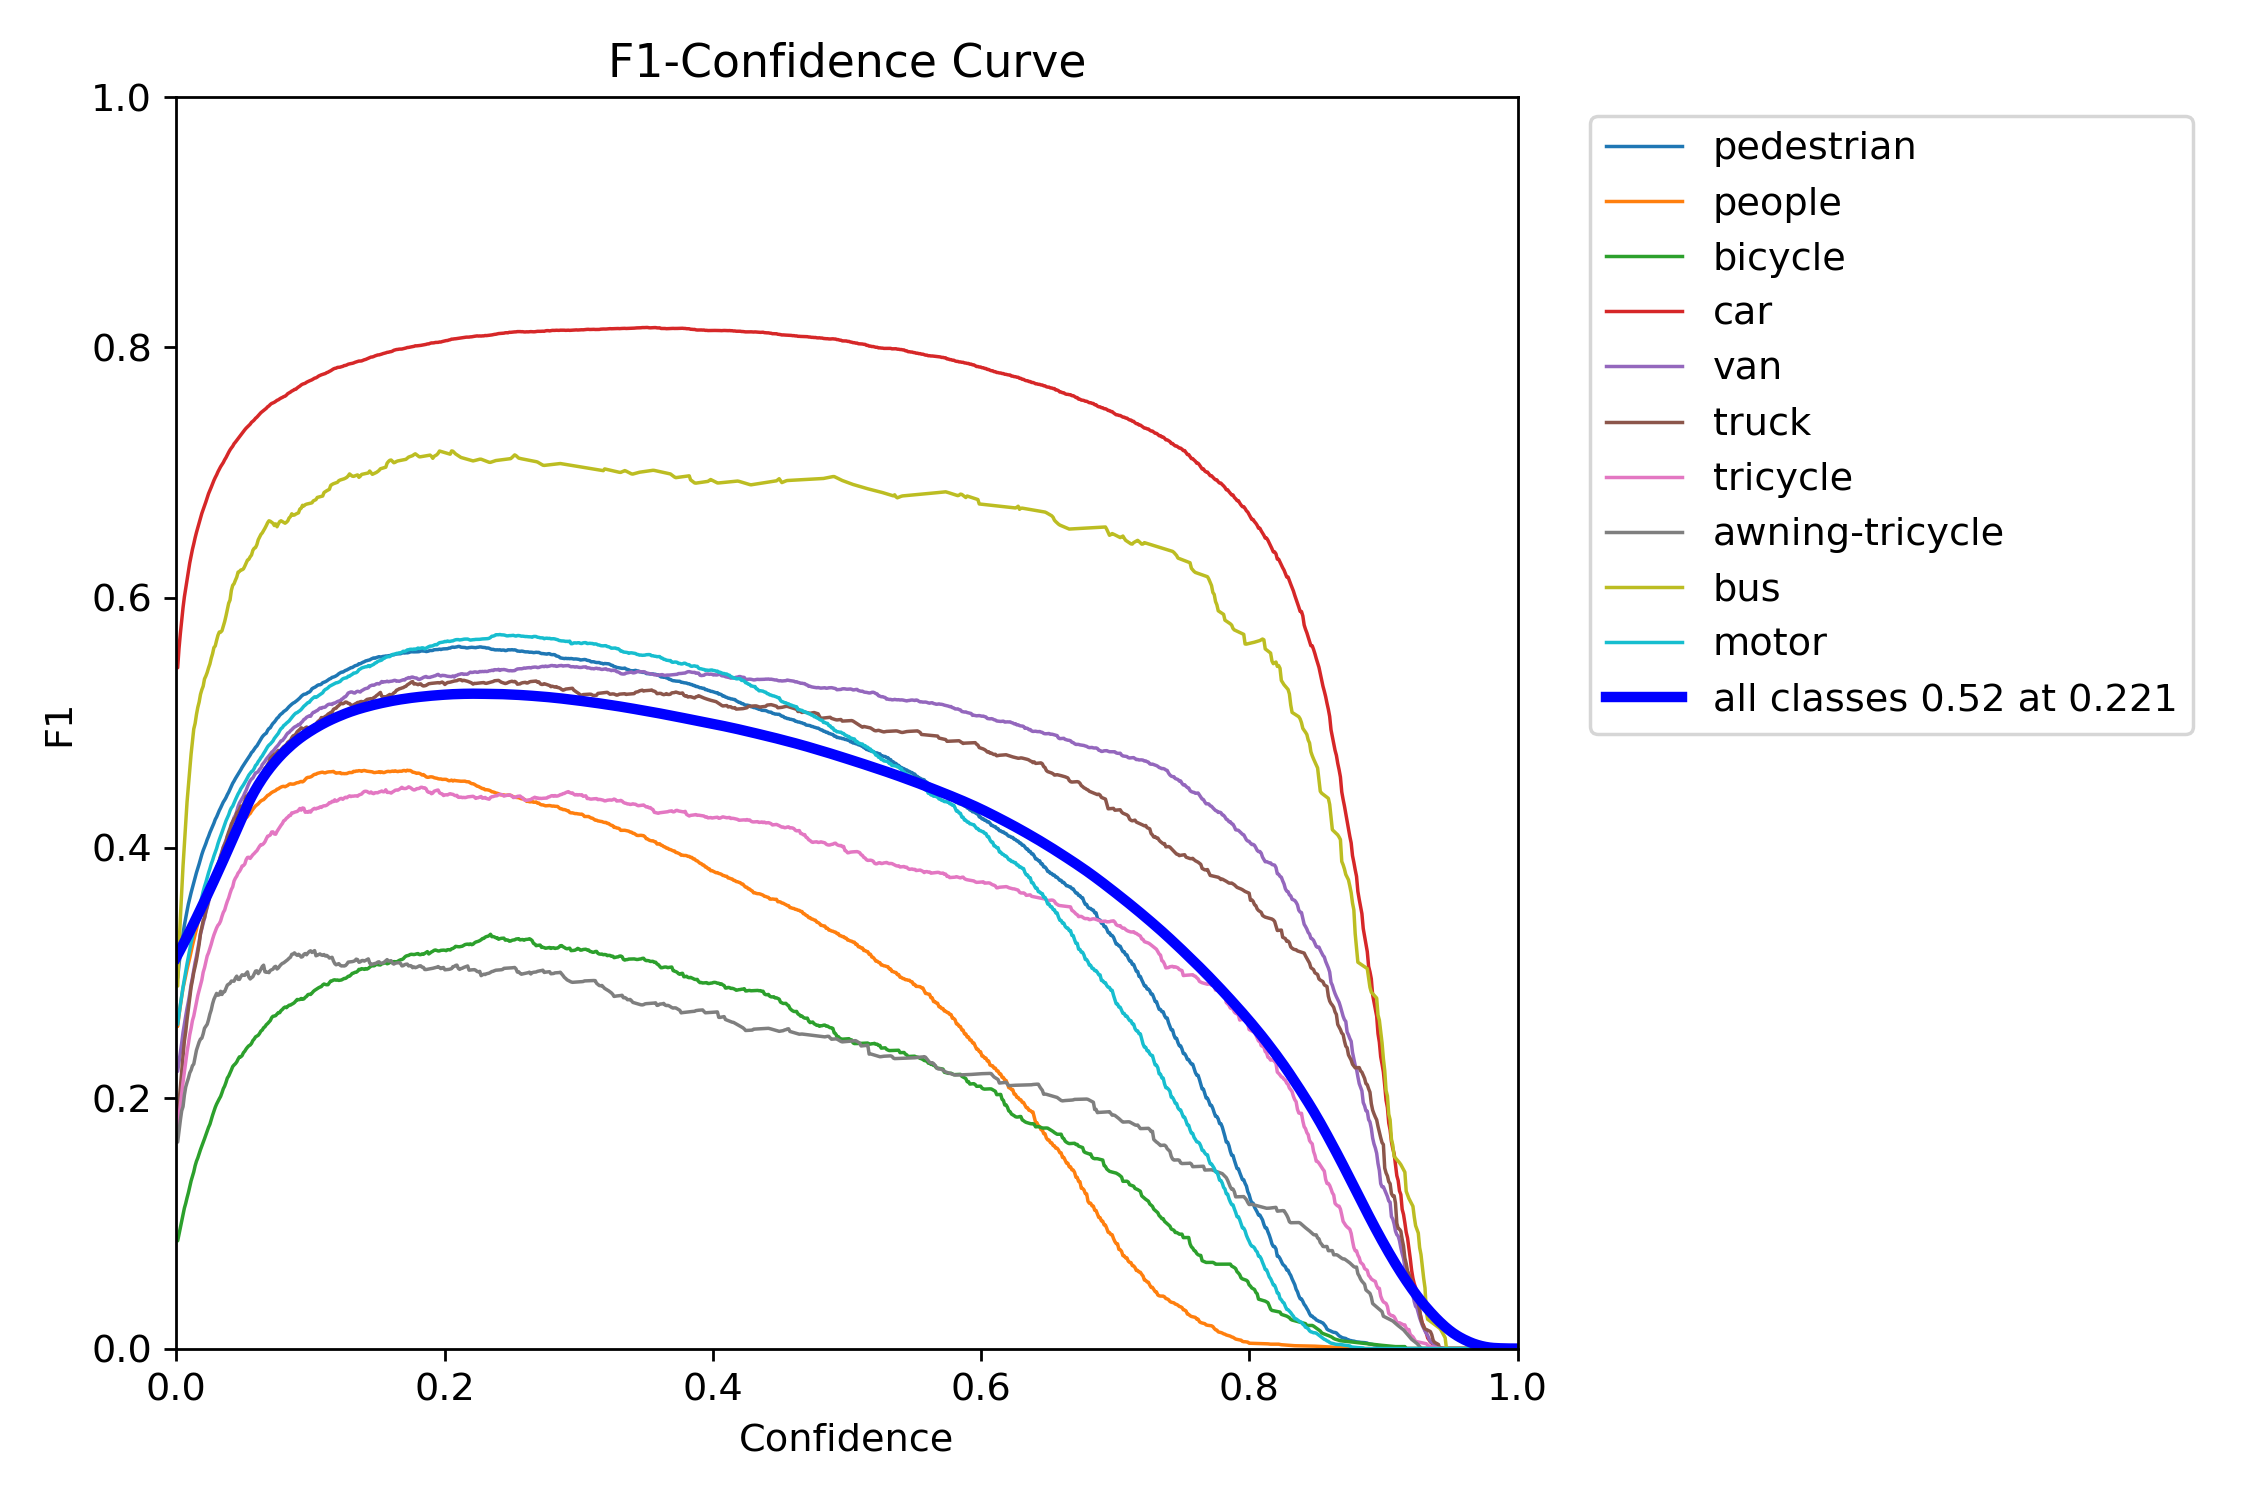
Figure 18 – YOLOv12x training F1–confidence curve
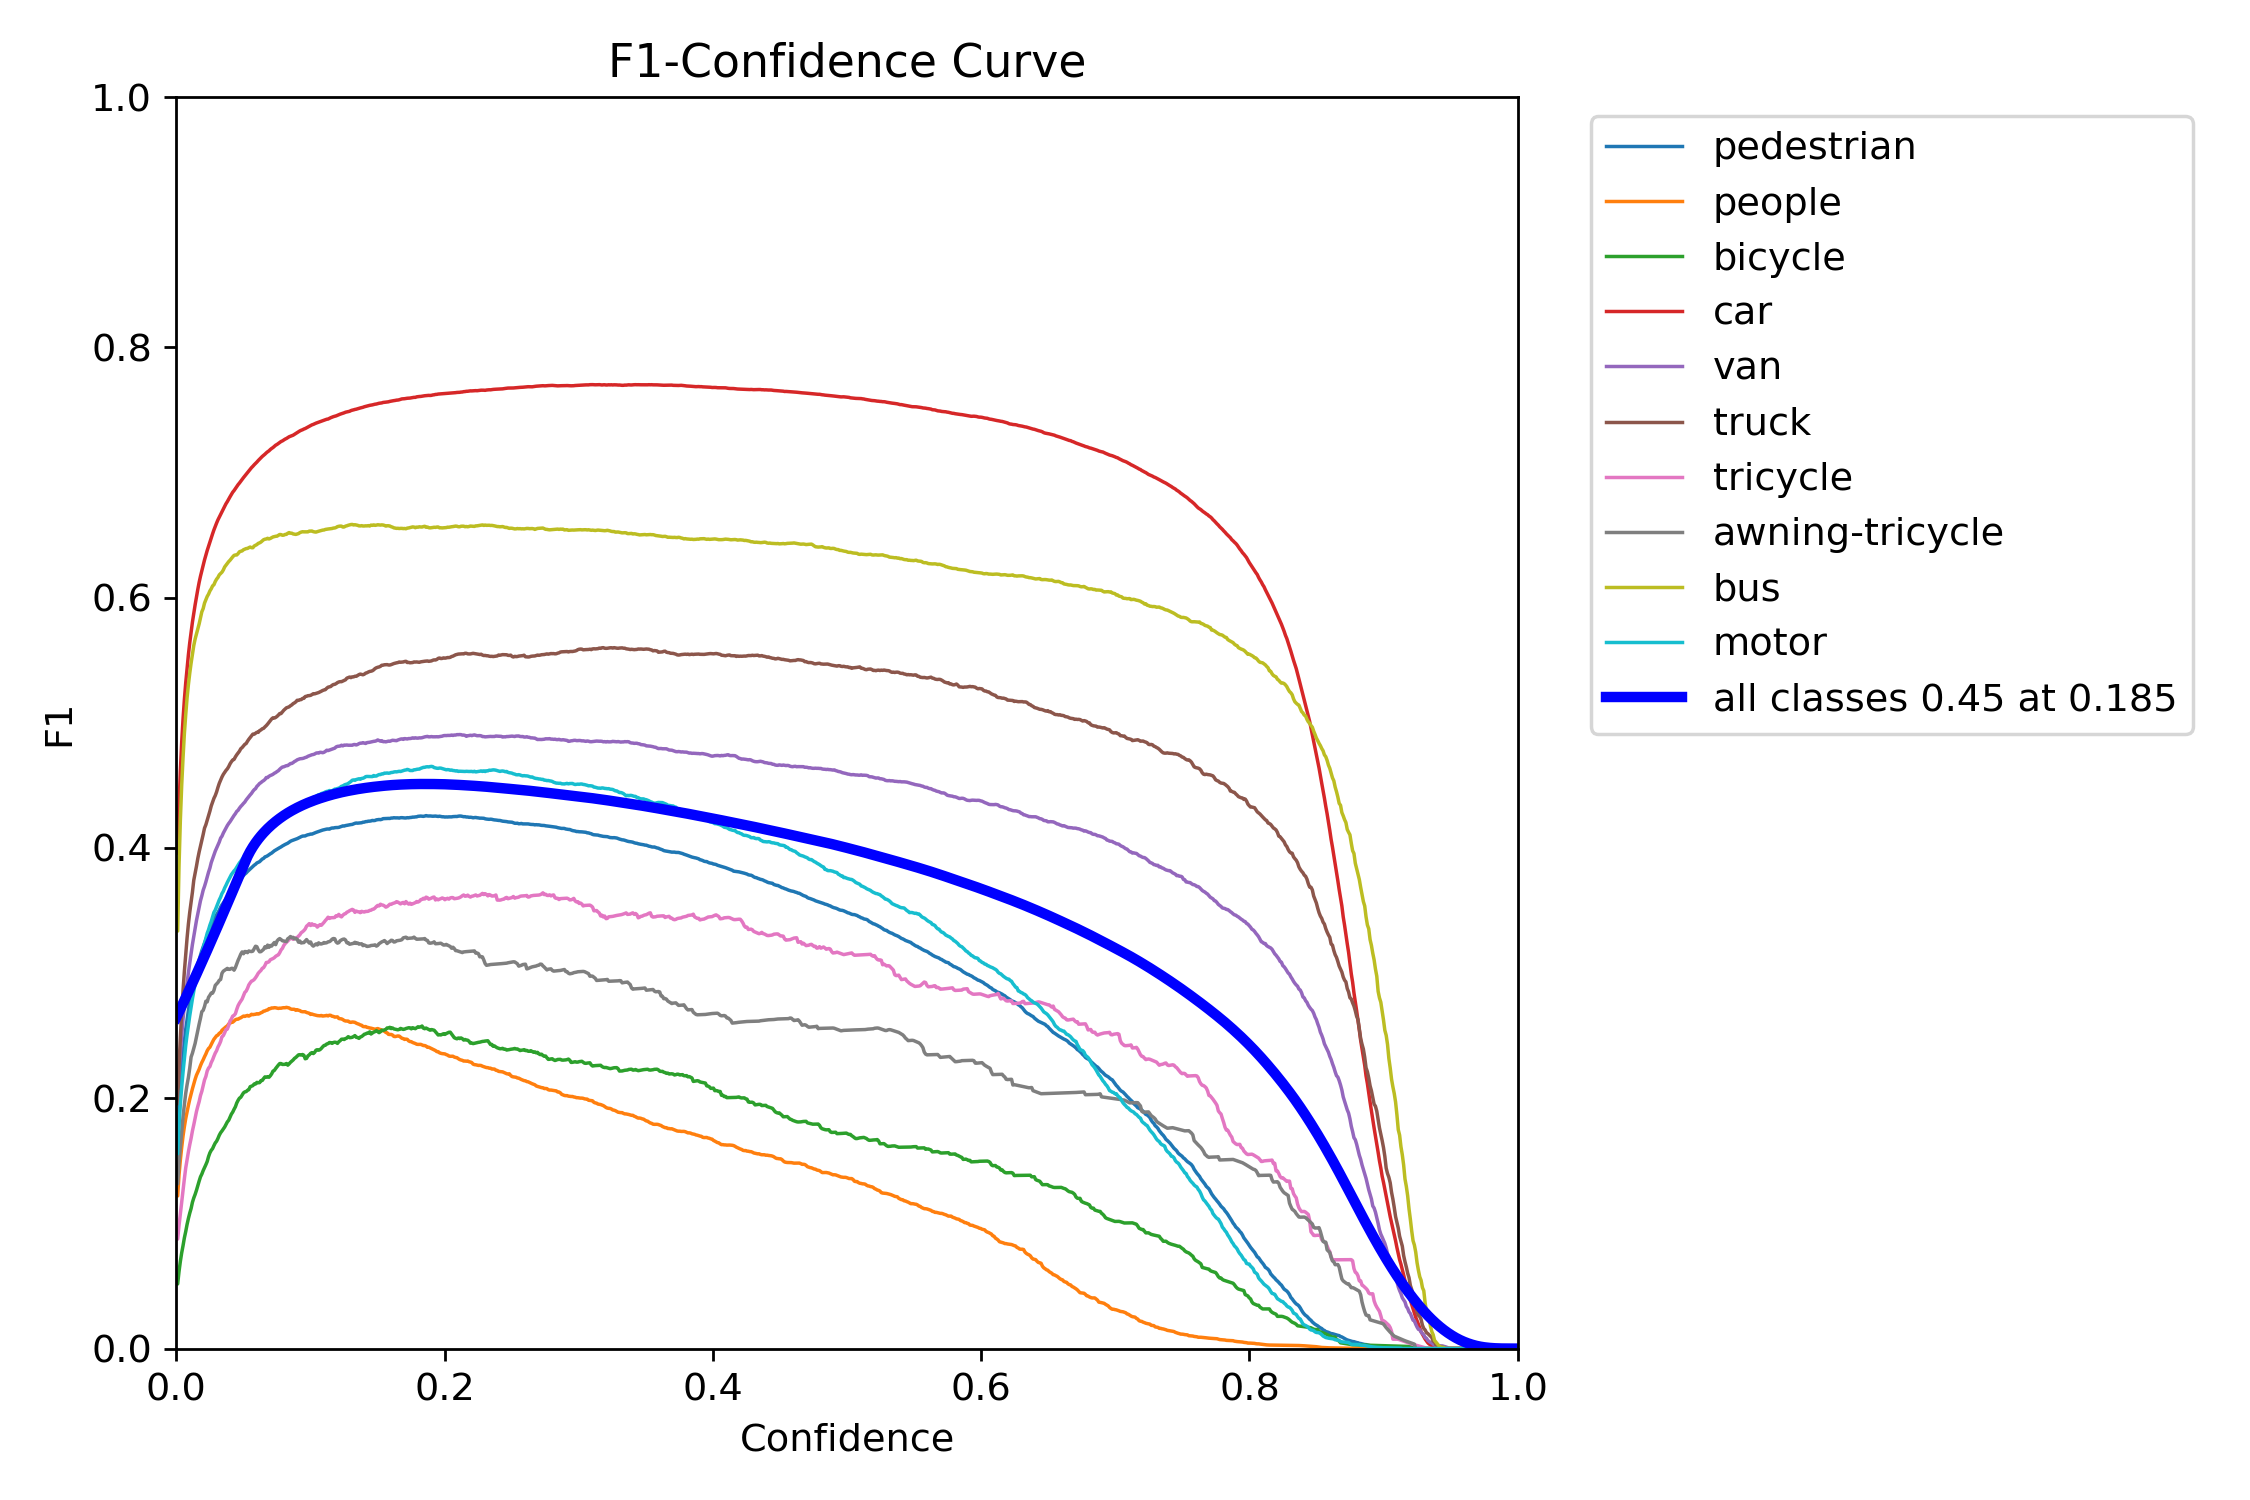
Figure 20 – YOLOv12x test F1–confidence curve
The F1 score balances precision and recall into a single metric across thresholds. YOLOv11s and YOLOv11x showed wide, stable F1 peaks, which means they were less sensitive to tuning and maintained performance across a range of thresholds. In contrast, YOLOv12s and YOLOv12x had steep, narrow peaks—highlighting a need for precise tuning and reduced tolerance to domain shift.
Confusion Matrices
Confusion Matrices of Small Variants (YOLOv11s vs. YOLOv12s):
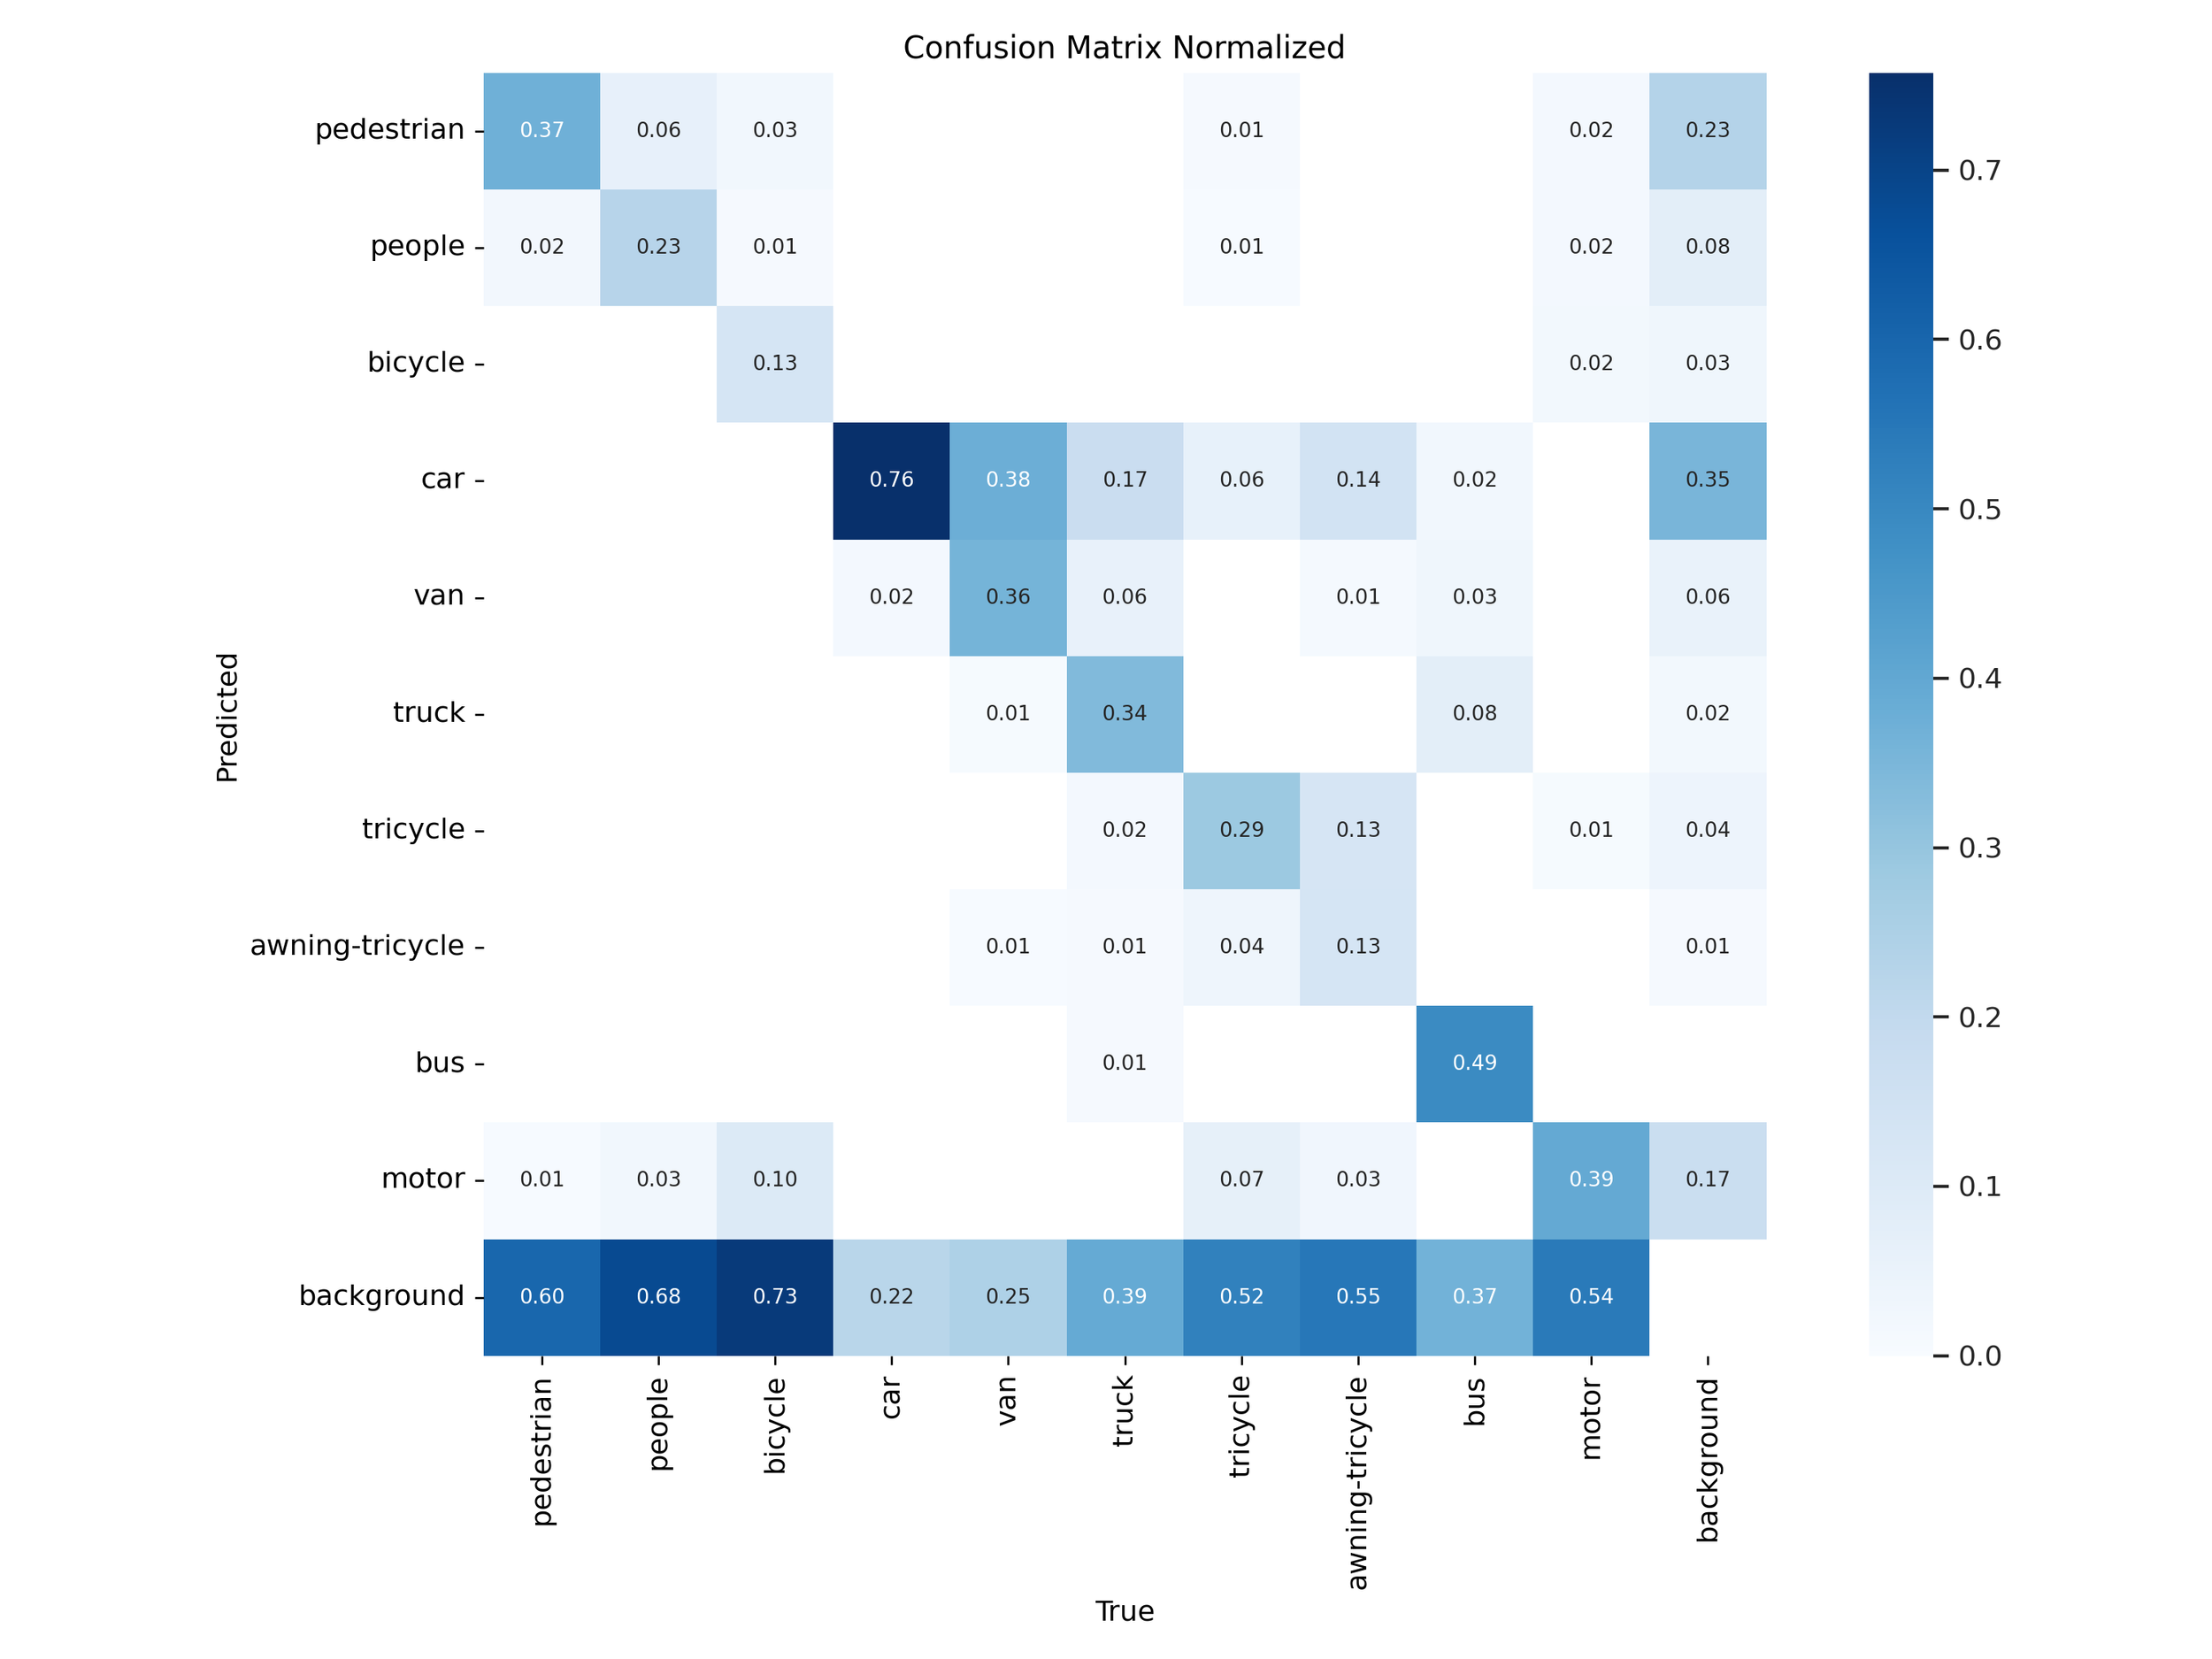
Figure 21 – YOLOv11s training confusion matrix
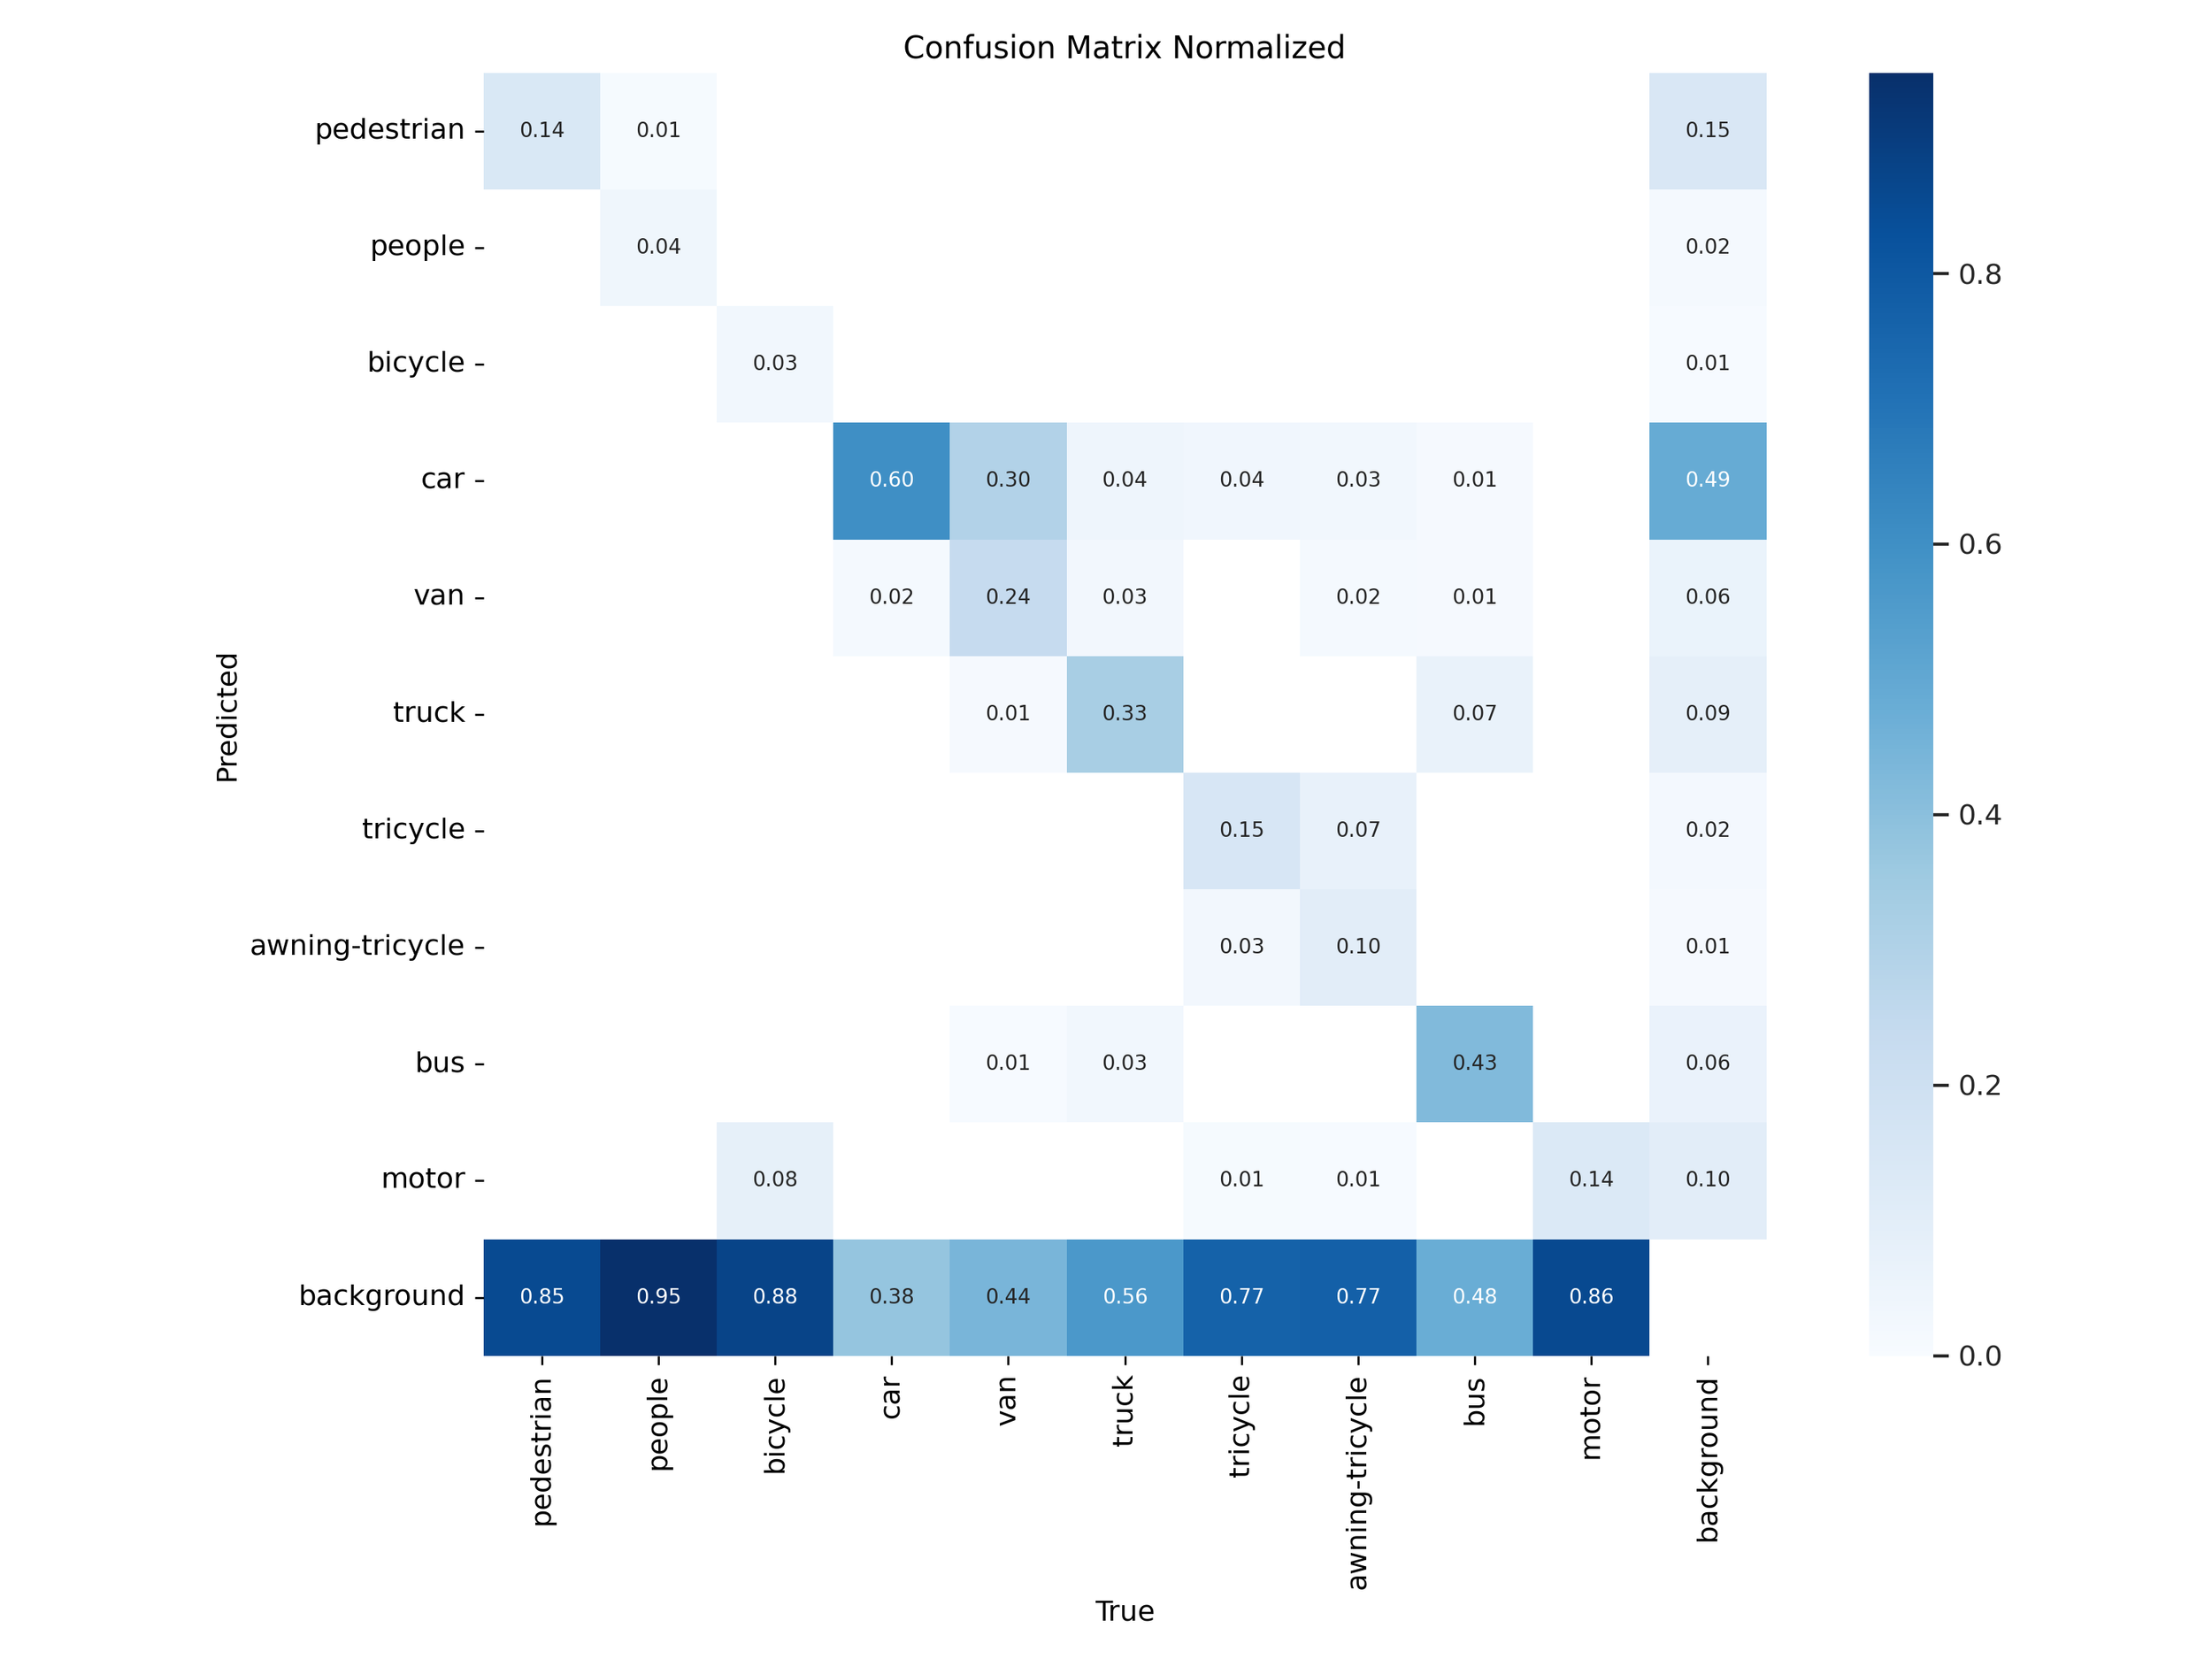
Figure 23 – YOLOv11s test confusion matrix

Figure 22 – YOLOv12s training confusion matrix
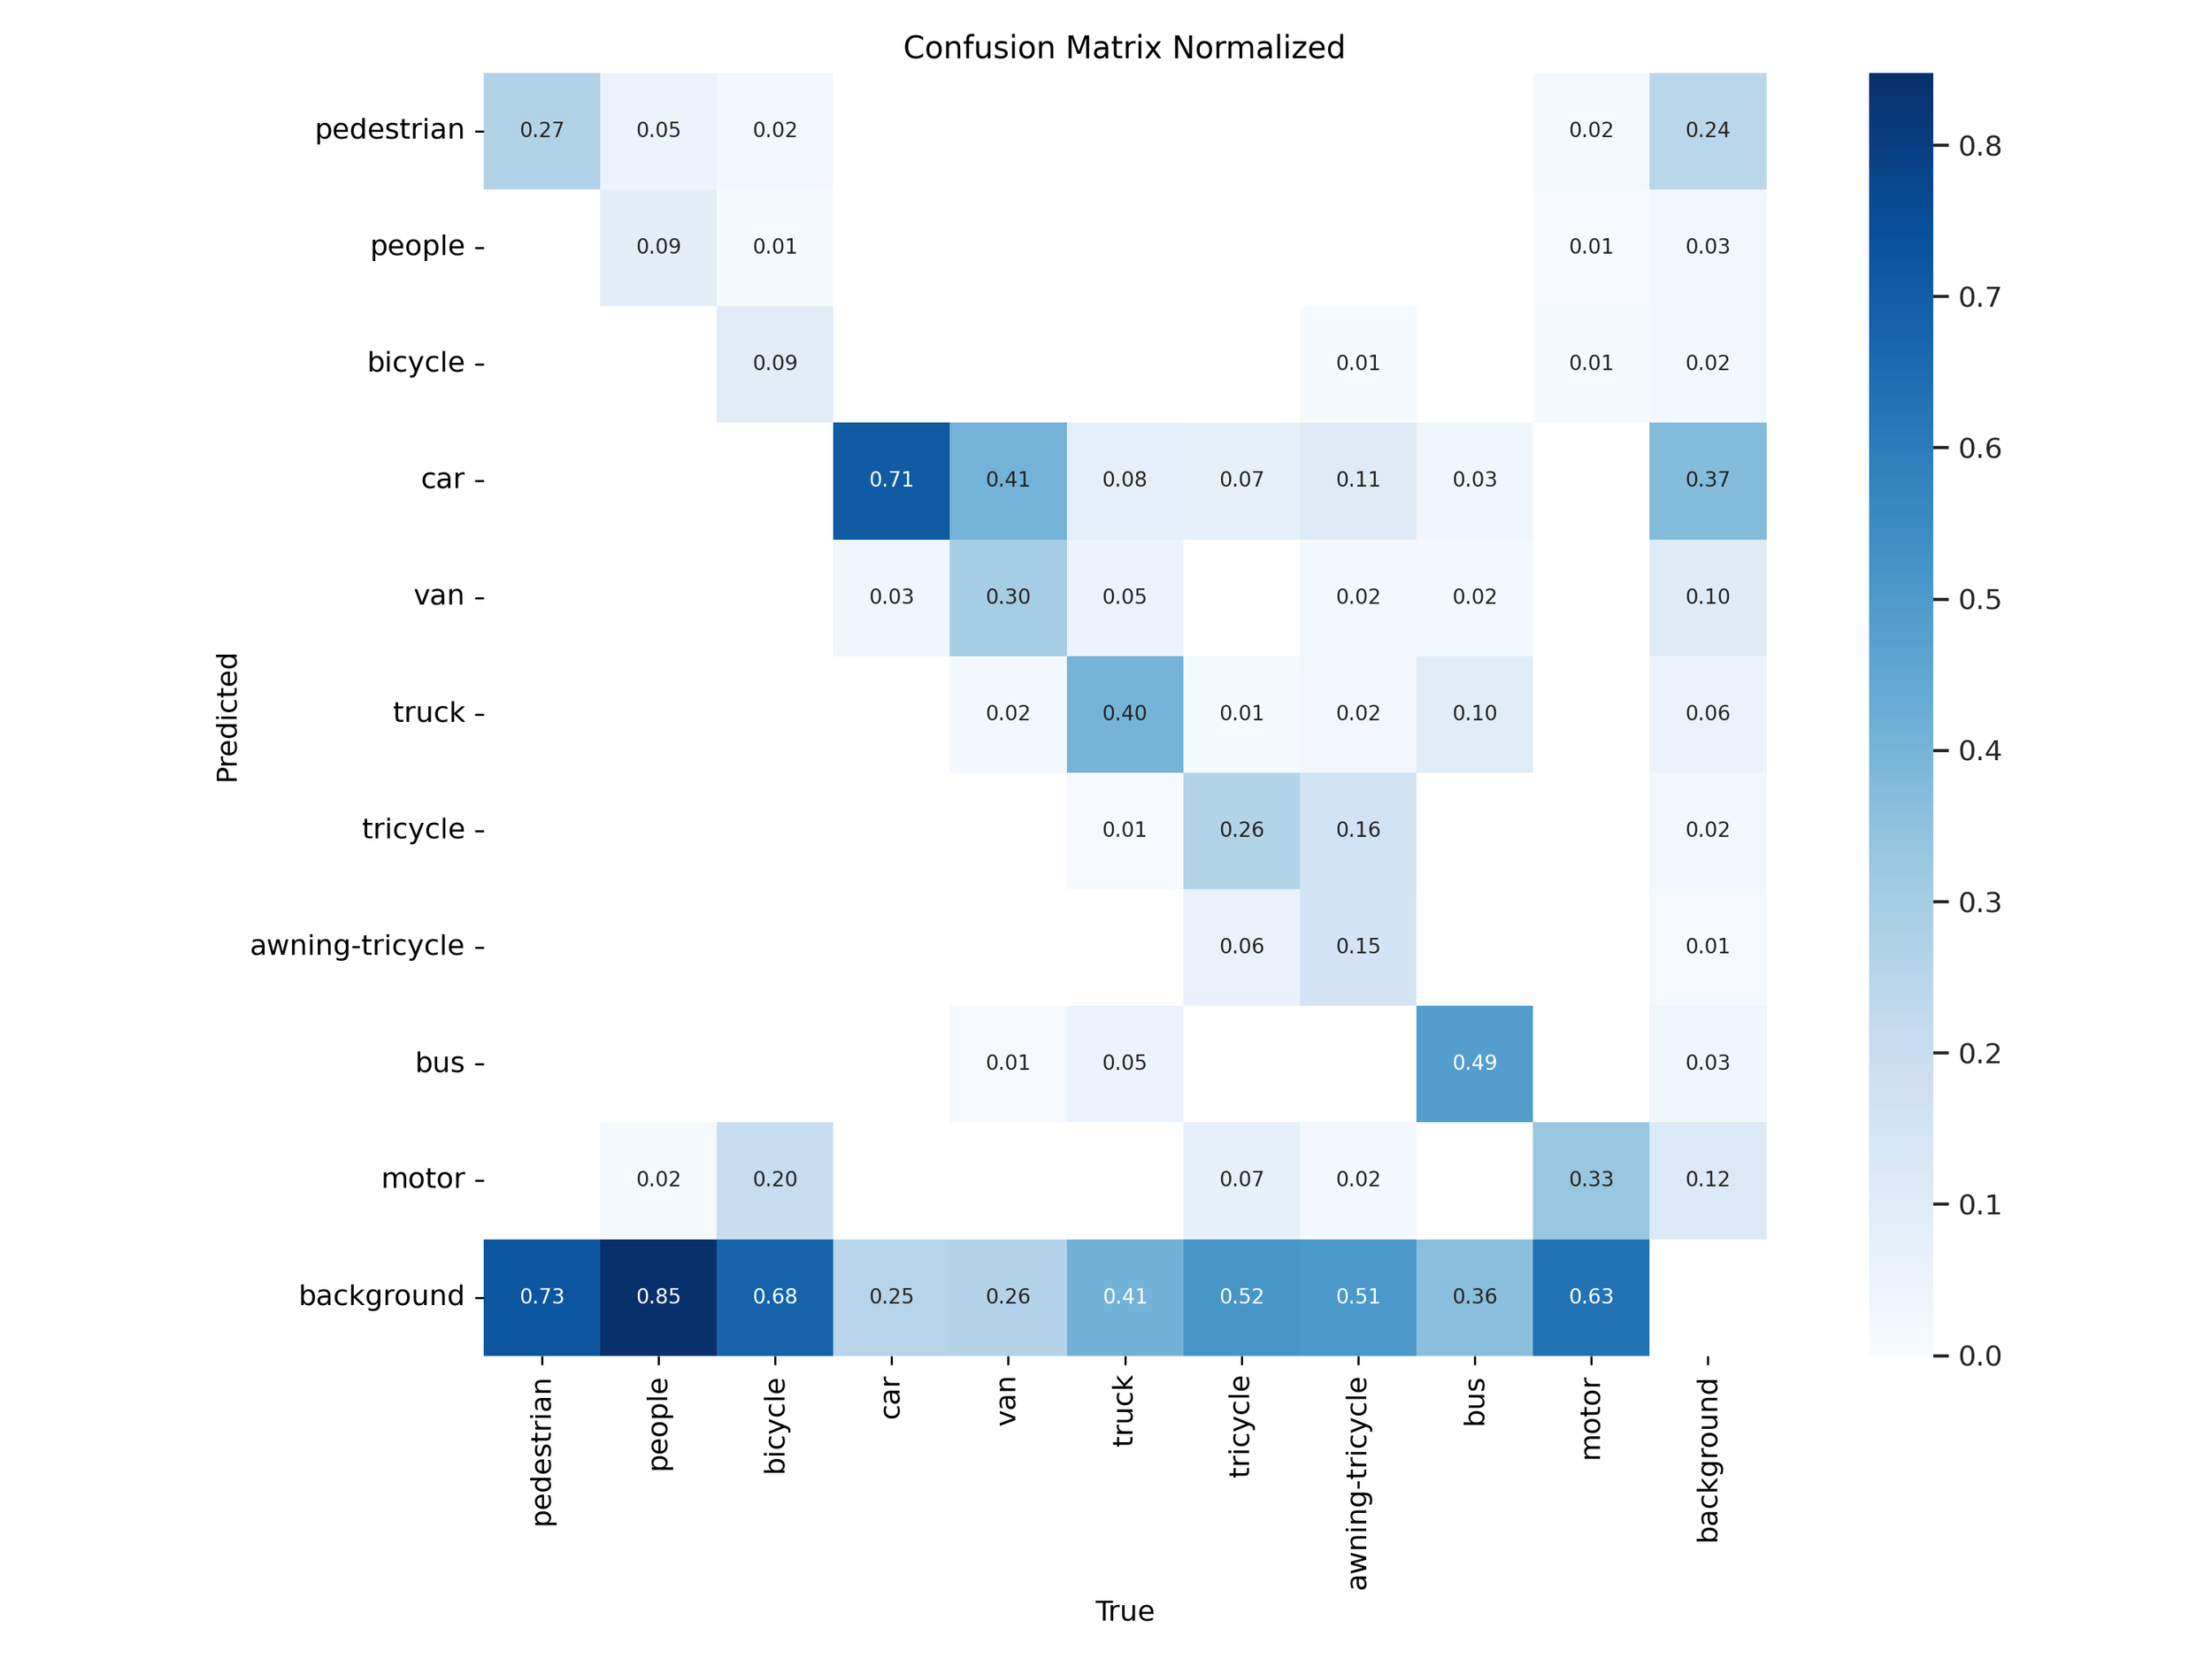
Figure 24 – YOLOv12s test confusion matrix
Confusion Matrices of Extra-Large Variants (YOLOv11x vs. YOLOv12x)
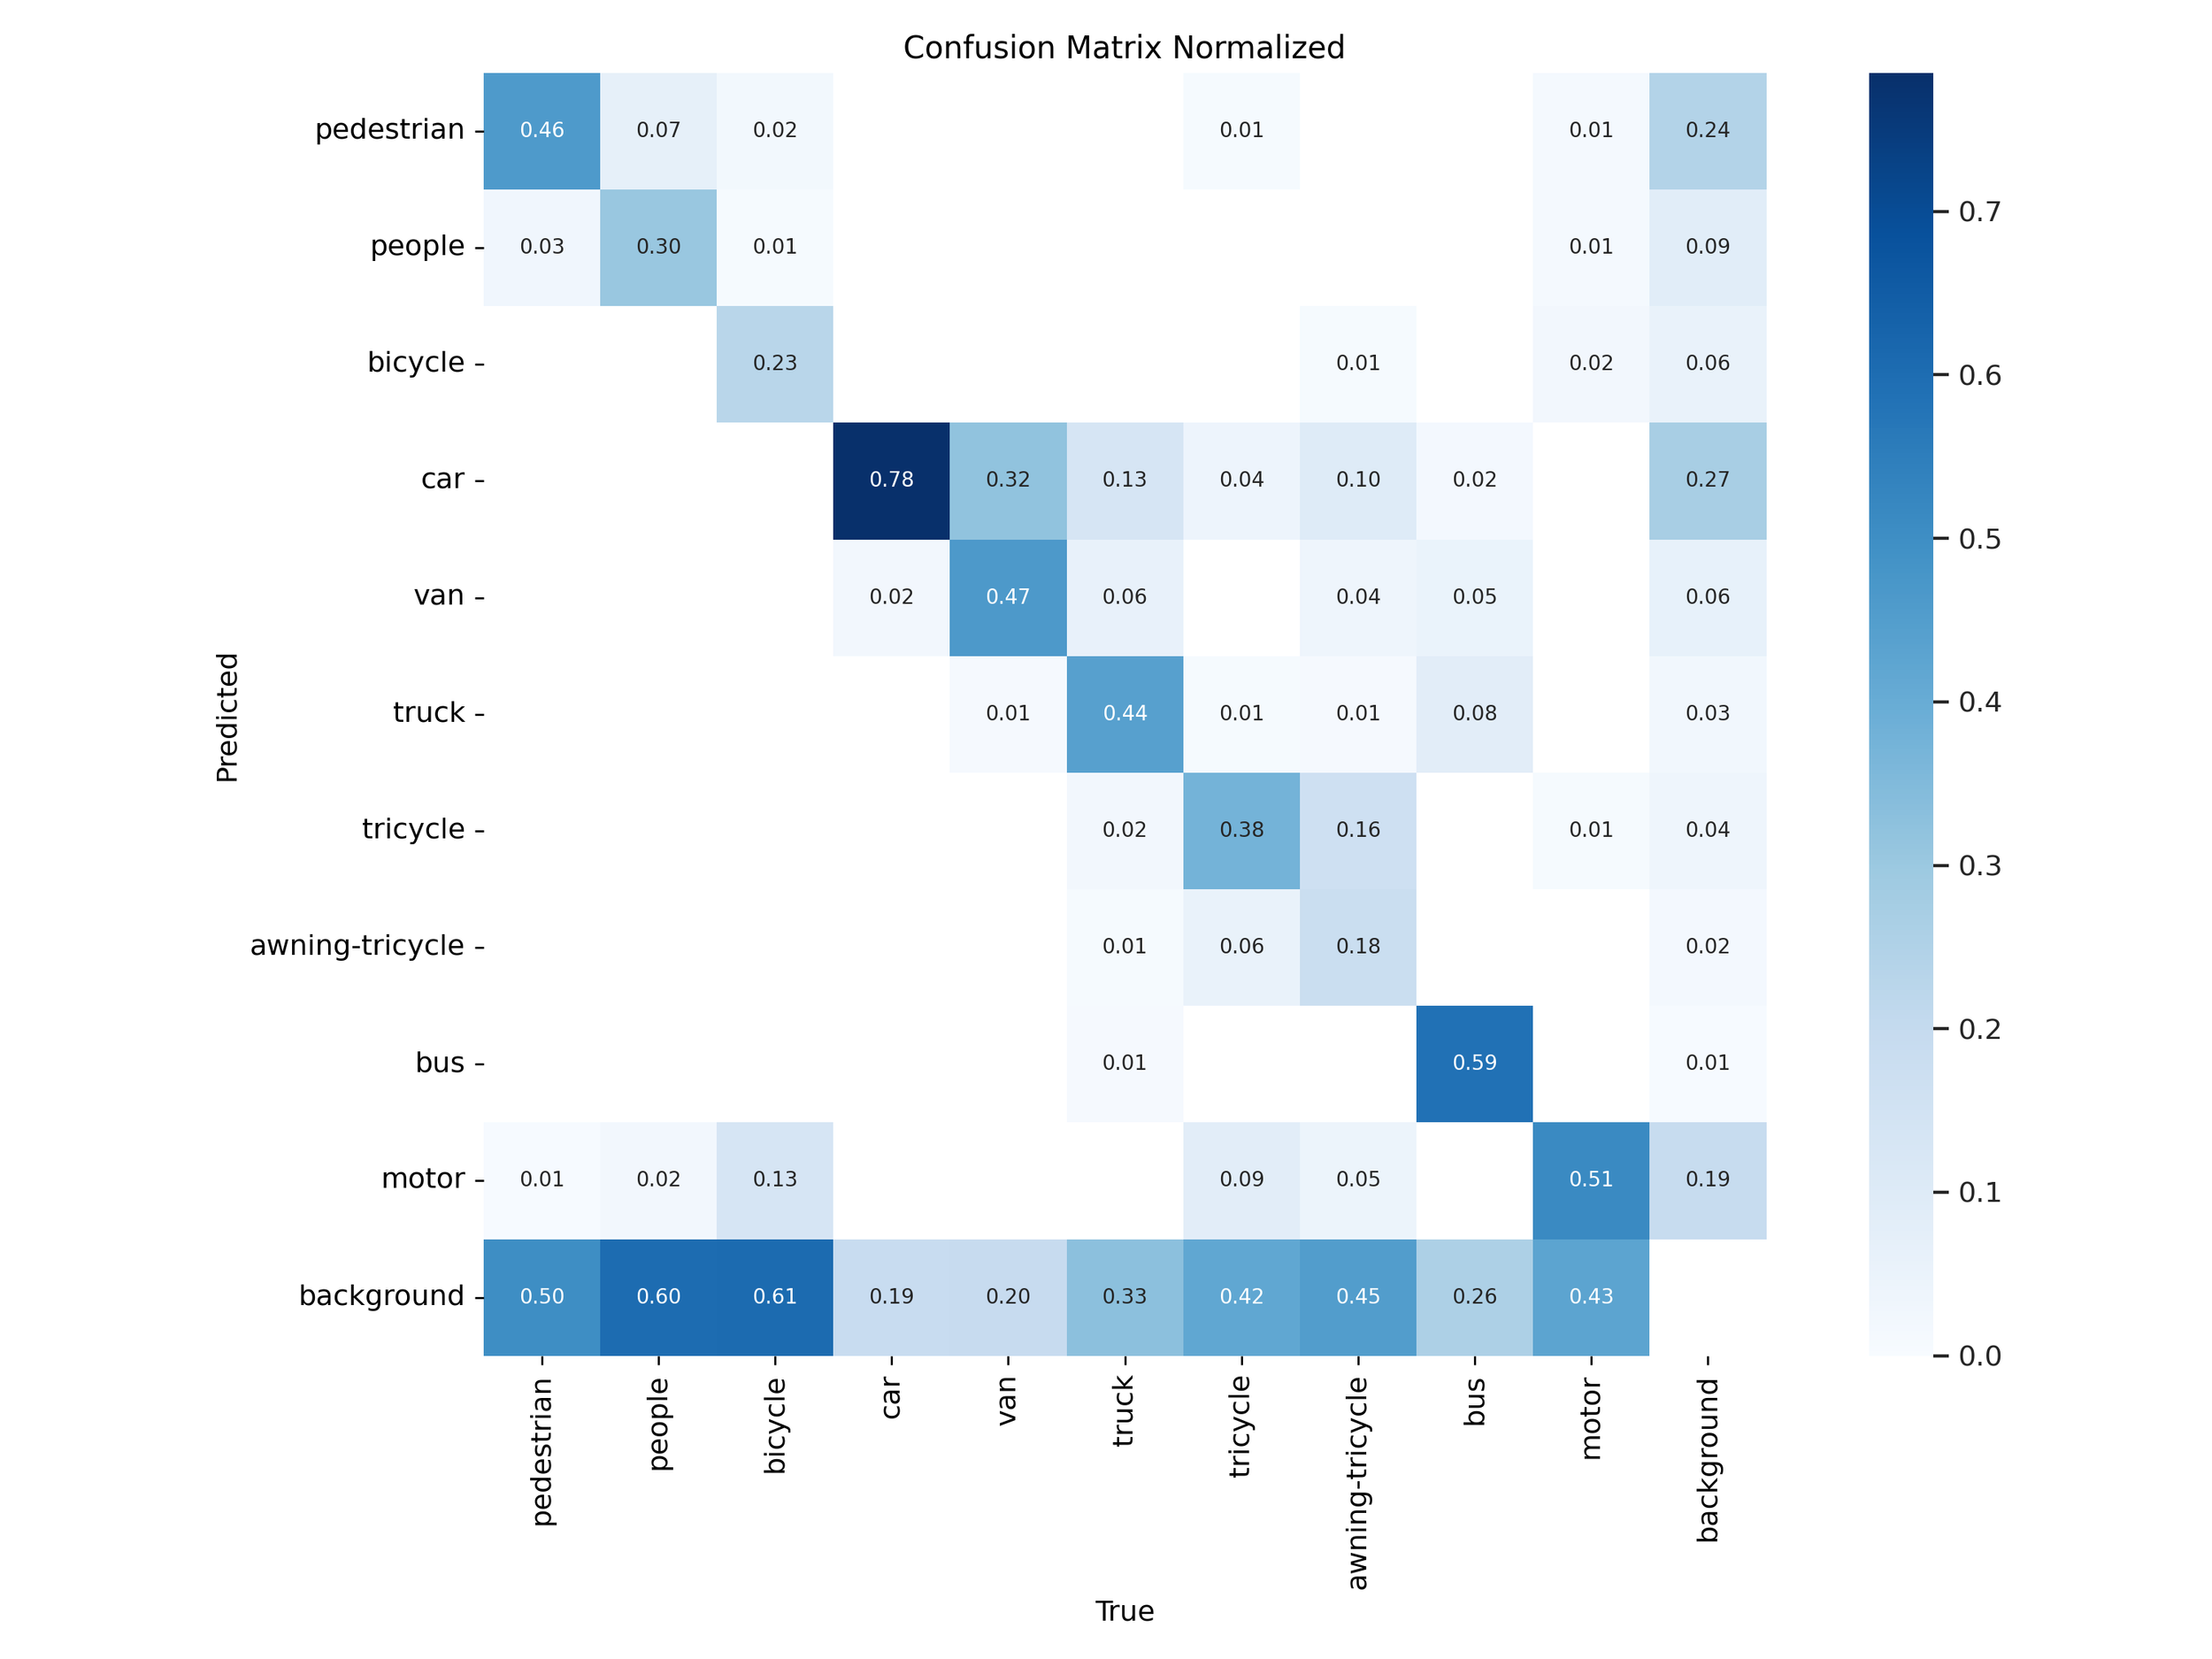
Figure 25 – YOLOv11x training confusion matrix
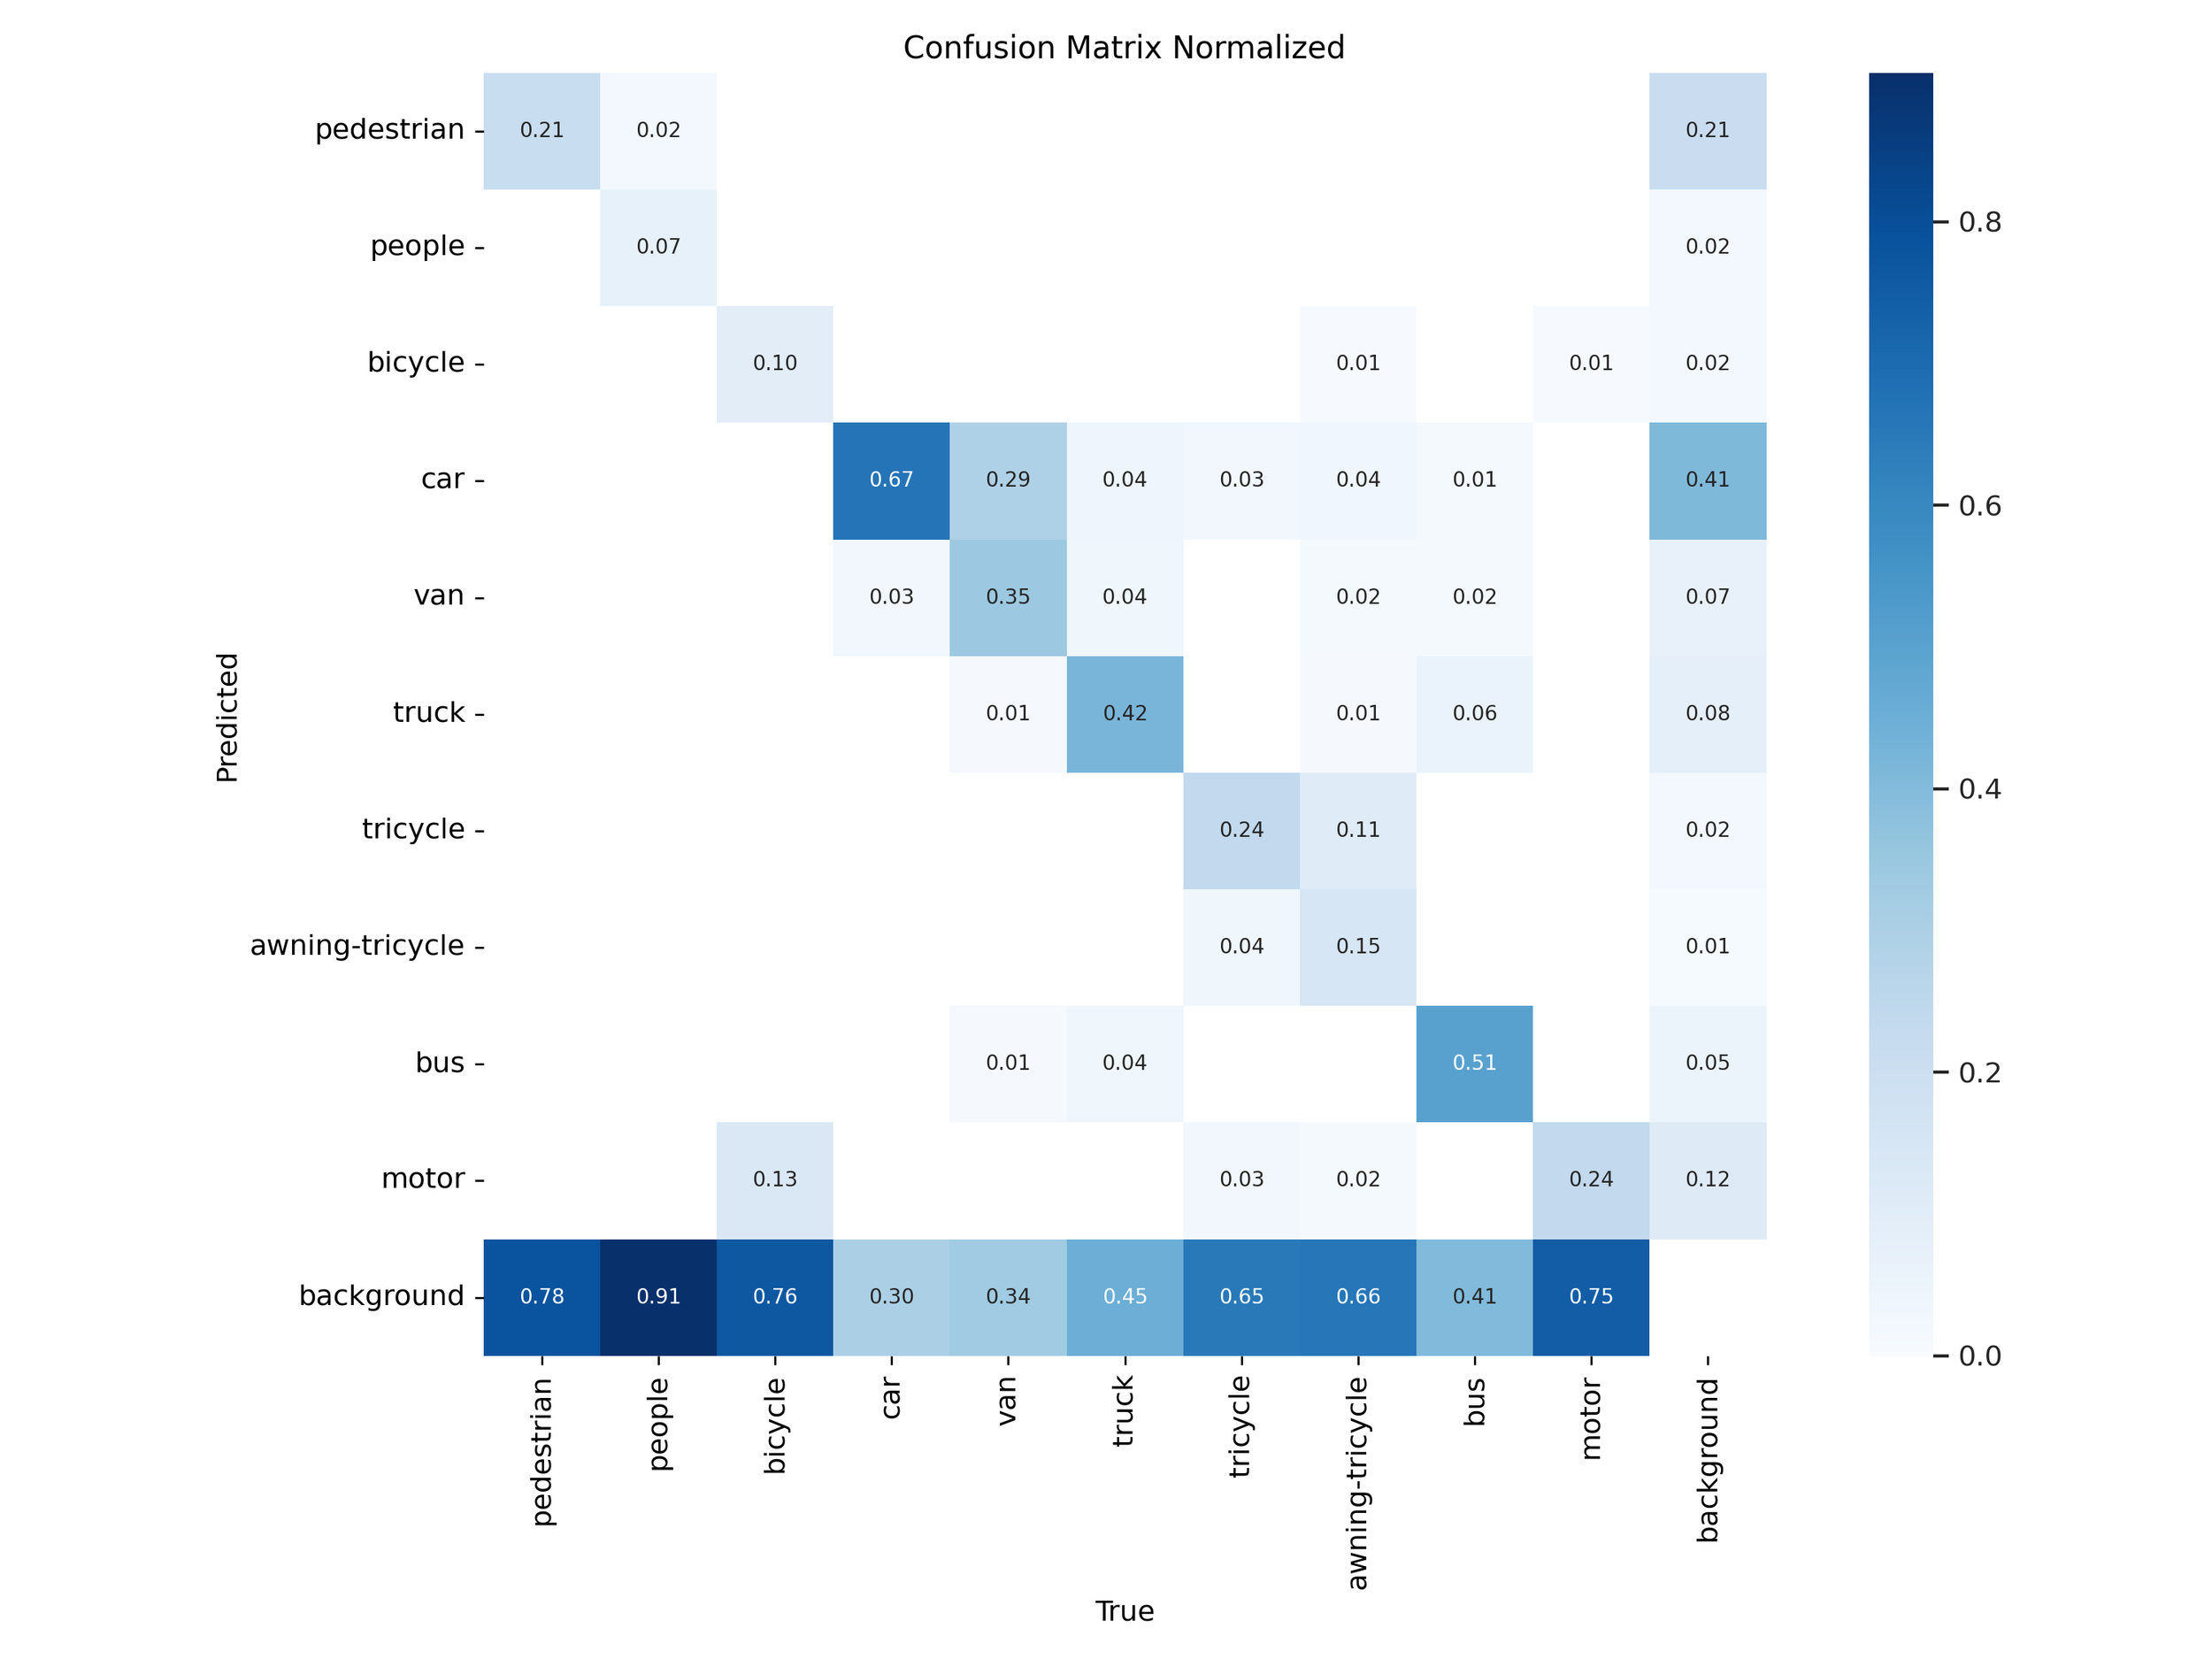
Figure 27 – YOLOv11x test confusion matrix
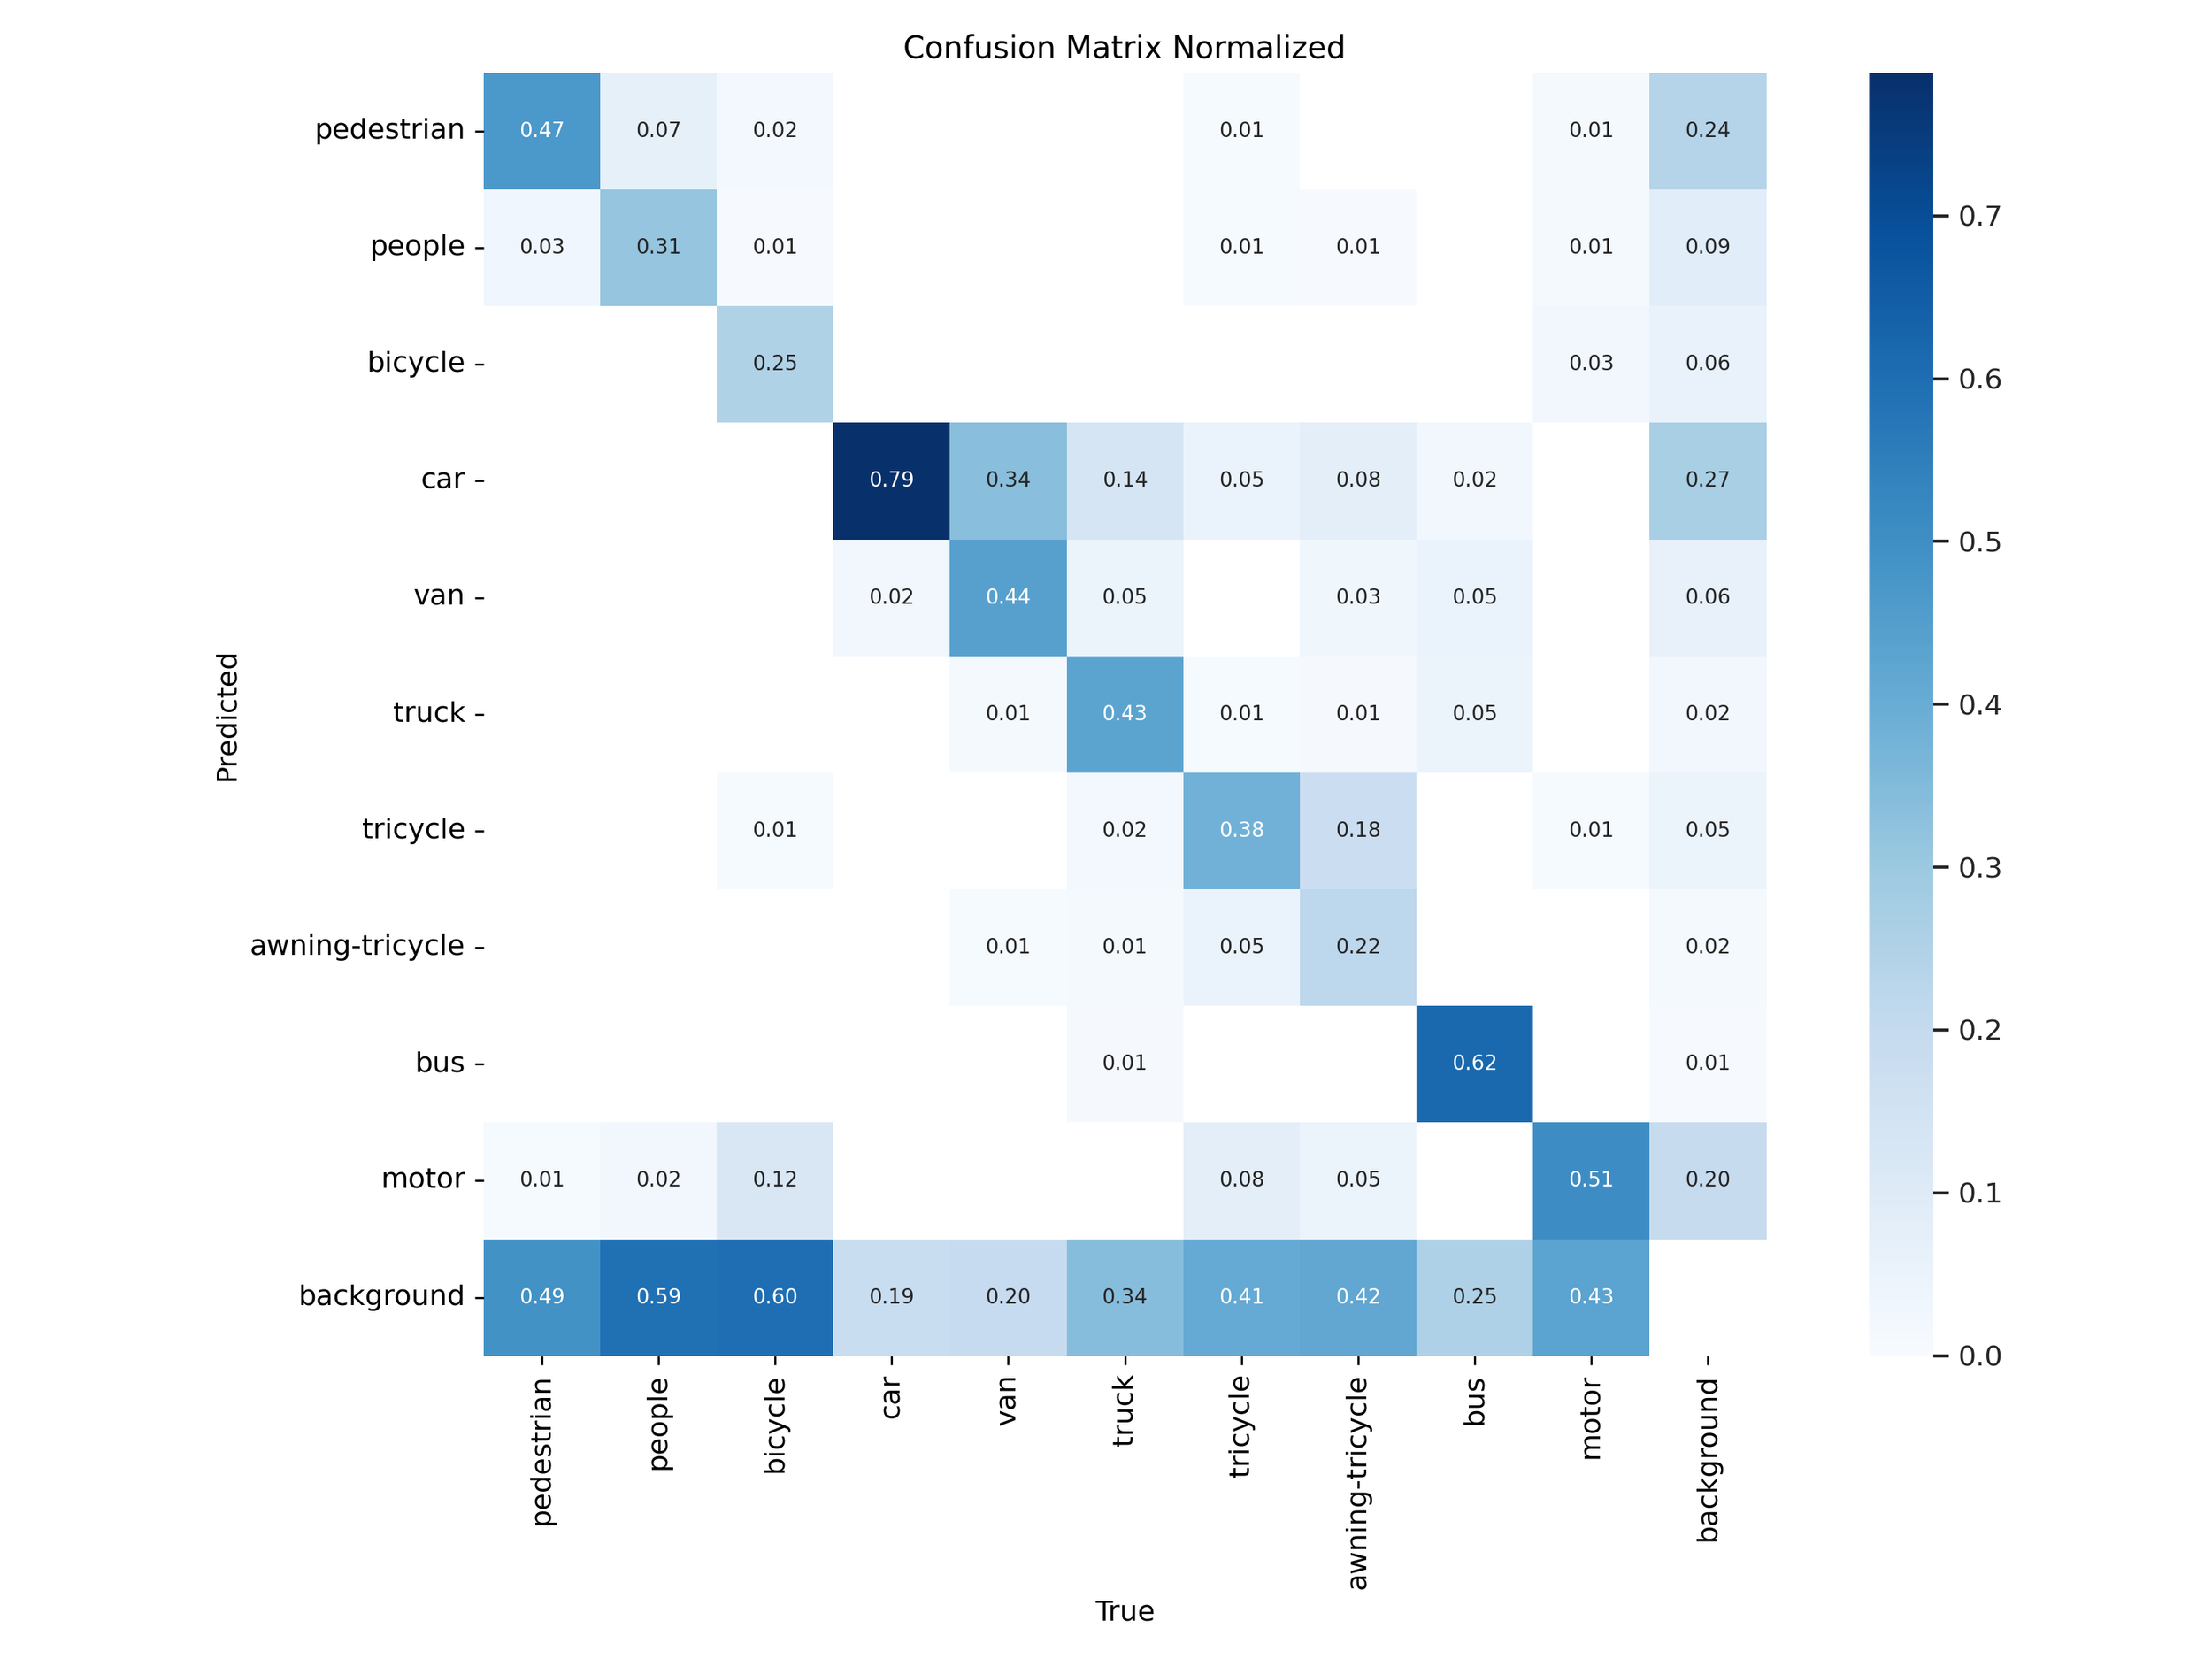
Figure 26 – YOLOv12x training confusion matrix
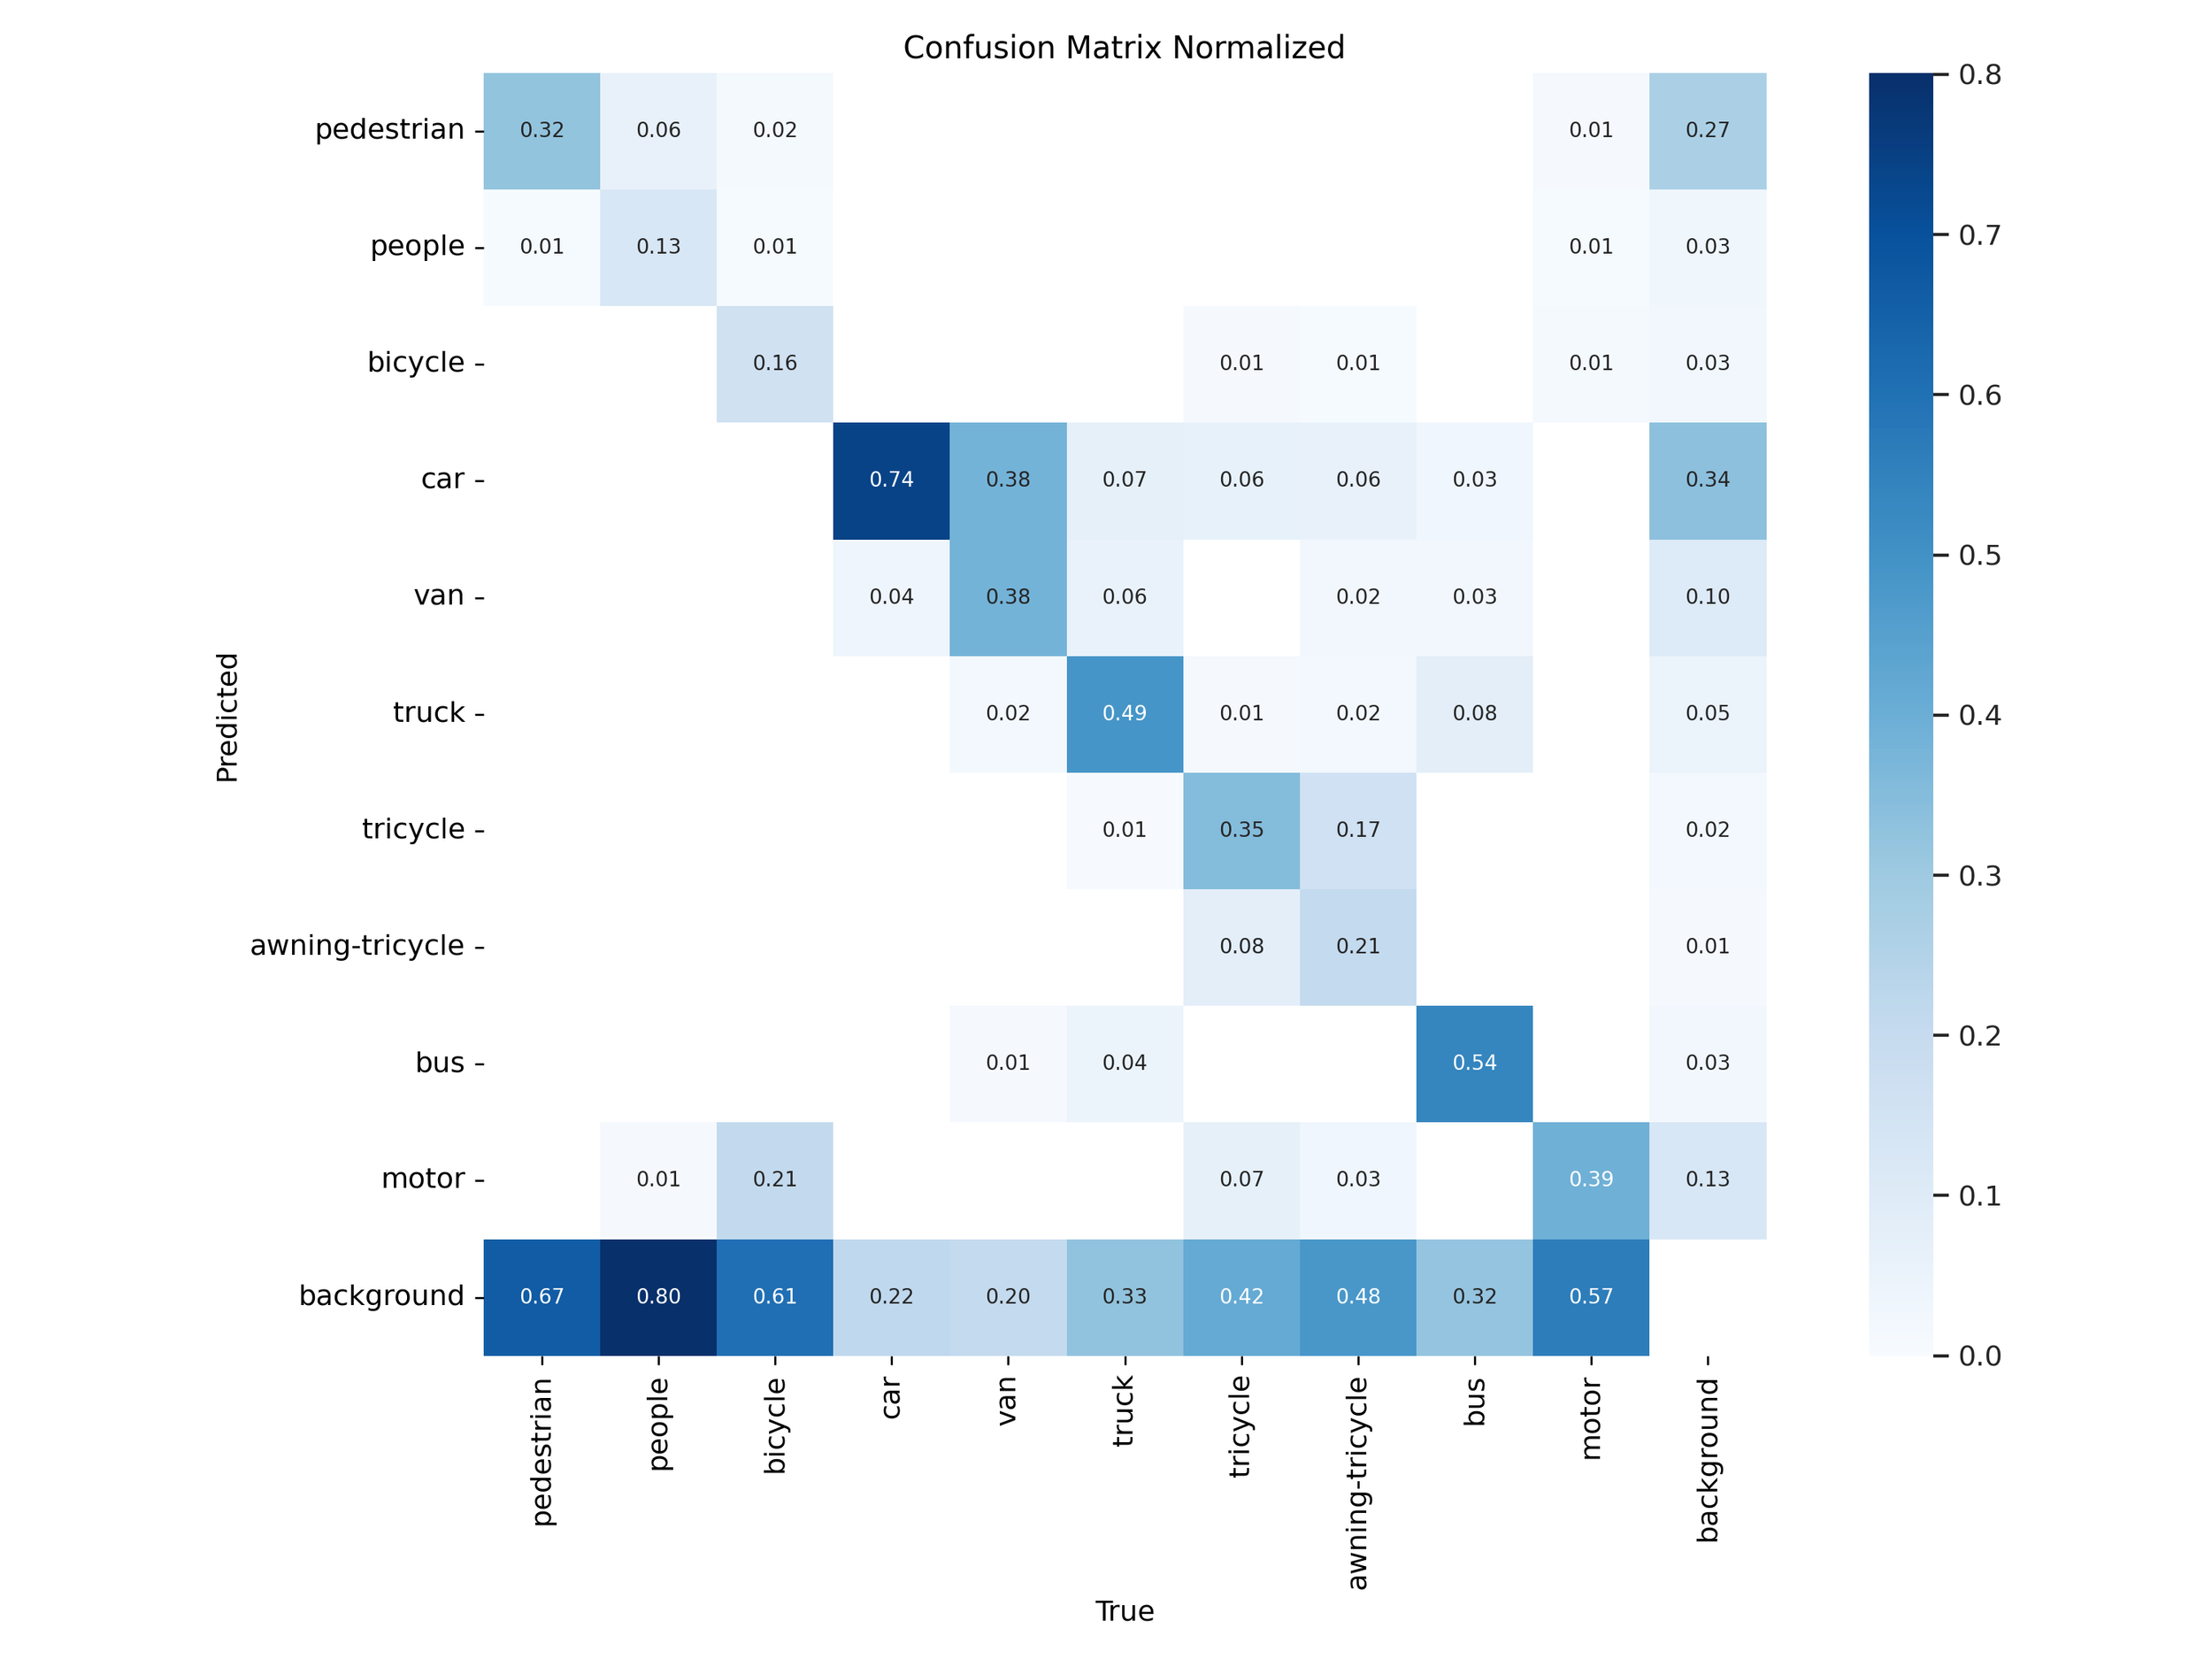
Figure 28 – YOLOv12x test confusion matrix
Normalized confusion matrices revealed that YOLOv11 handled common classes like car, bus, and pedestrian more accurately in both “s” and “x” tiers. YOLOv12 models showed slight improvements on rare classes like awning-tricycle, but this came at the expense of higher misclassification rates across more frequently occurring objects.
Overall Performance
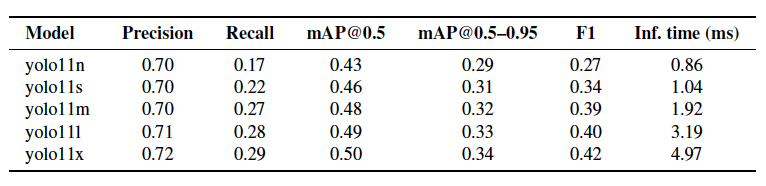
Table 1 – Overall detection performance for the YOLOv11 family on VisDrone
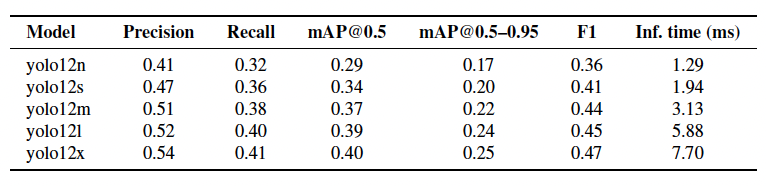
Table 2 – Overall detection performance for the YOLOv12 family on VisDrone
When comparing speed and accuracy directly, YOLOv11 delivered stronger performance across both tiers:
YOLOv11s: 0.46 mAP@0.5 in 1.04 ms
YOLOv12s: 0.34 mAP@0.5 in 1.94 ms
YOLOv11x: 0.50 mAP@0.5 in 4.97 ms
YOLOv12x: 0.40 mAP@0.5 in 7.70 ms
YOLOv11 had lower latency and higher accuracy in both lightweight and high-capacity configurations, making it more suitable across a wider range of use cases.
Per-class ap50-95
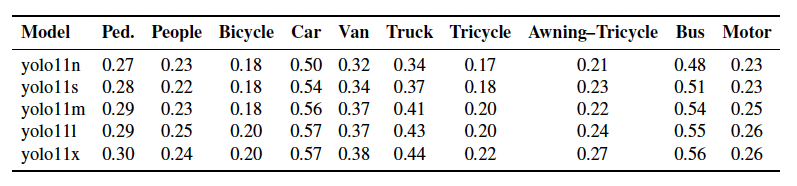
Table 3 – Per-class AP₅₀–₉₅ for YOLOv11 variants on VisDrone
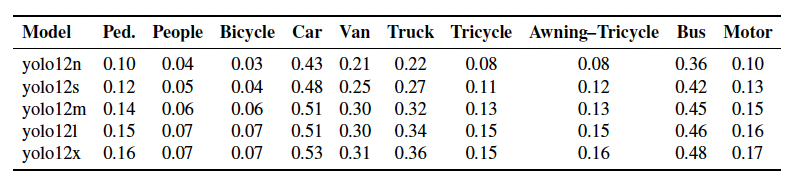
Table 4 – Per-class AP₅₀–₉₅ for YOLOv12 variants on VisDrone
Class-level breakdown showed that YOLOv11 maintained higher AP on high-frequency targets:
Cars: 0.57 (v11x) vs. 0.53 (v12x)
Pedestrians: 0.30 (v11x) vs. 0.16 (v12x)
Buses: 0.56 (v11x) vs. 0.48 (v12x)
While YOLOv12x had marginal gains on rare categories like tricycles, both models struggled in these areas due to class imbalance, smaller object size, and heavier occlusion typical of the VisDrone dataset.
Generalization Gaps & Retention Ratio

Table 5 – Generalization gap (Δ) and retention ratio (Ret.) for the YOLOv11 and YOLOv12 “s” and “x” variants on VisDrone
To evaluate cross-domain robustness, we measured how much performance dropped from COCO to VisDrone:
YOLOv11s: 1.0 pt drop, 97.9% retained
YOLOv12s: 16.2 pt drop, 67.7% retained
YOLOv11x: 4.7 pt drop, 91.4% retained
YOLOv12x: 16.1 pt drop, 71.4% retained
YOLOv12 retained more of its benchmark behavior proportionally, but YOLOv11 consistently achieved higher absolute accuracy in dense, real-world scenes—highlighting better adaptability.
Latency Observations
YOLOv12’s additional architectural components—R-ELAN, FlashAttention, and 7×7 separable convolutions—resulted in longer inference times:
YOLOv11s: 1.04 ms vs. YOLOv12s: 1.94 ms
YOLOv11x: 4.97 ms vs. YOLOv12x: 7.70 ms
In time-sensitive environments like UAV navigation or live object tracking, these latency differences can introduce noticeable delays. YOLOv11’s faster runtime makes it better suited for real-time deployment on both edge and GPU-backed platforms.
COCO Benchmark comparison

Table 6 – Official COCO-validation metrics for YOLOv11 and YOLOv12 at 640×640 resolution
YOLOv12 outperformed YOLOv11 across all five model sizes (n→x) on the COCO dataset:
n: 40.6% vs. 39.5% mAP₅₀–₉₅
s: 50.2% vs. 47.0%
m: 54.1% vs. 51.5%
l: 55.3% vs. 53.4%
x: 56.3% vs. 54.7%
mAP gains ranged from +1.1 to +3.2 points, peaking with a +3.1% increase in the “m” variant. The added latency was modest, increasing by only ~0.1–1.2 ms per image:
s: 2.8 ms (v12) vs. 2.5 ms (v11)
x: 12.5 ms (v12) vs. 11.3 ms (v11)
Best COCO performer: YOLOv12x — 56.3% mAP₅₀–₉₅ at 12.5 ms
Conclusion
This project helped us see that newer isn’t always better. YOLOv12 introduced technical upgrades like FlashAttention and deeper backbones that improved benchmark scores, but they also required more computation. In contrast, YOLOv11 delivered more reliable performance in real-world aerial detection while running faster. For applications involving UAVs or edge devices, YOLOv11—especially the “m” variant—offered a better balance between accuracy and inference speed.
We learned a lot about training under practical constraints, working with complex datasets, and troubleshooting models when results didn’t align with expectations. The experience reinforced the idea that field conditions—and computational efficiency—matter just as much as benchmark scores when choosing a model.
Files and Code
REFERENCES
[1] M. A. R. Alif and M. Hussain, “YOLOv12: A breakdown of the key architectural features,” arXiv preprint, arXiv:2502.14740, 2025.
[2] A. Bochkovskiy, C.-Y. Wang, and H.-Y. M. Liao, “YOLOv4: Optimal speed and accuracy of object detection,” arXiv preprint, arXiv:2004.10934, 2020.
[3] P. Hidayatullah, N. Syakrani, M. R. Sholahuddin, T. Gelar, and R. Tubagus, “YOLOv8 to YOLOv11: A comprehensive architecture in-depth comparative review,” arXiv preprint, arXiv:2501.11345, 2025.
[4] G. Jocher and M. R. Munawar, “YOLO by Ultralytics,” Ultralytics Documentation, https://docs.ultralytics.com, 2023. Accessed: Apr. 15, 2025.
[5] J. Redmon, S. Divvala, R. Girshick, and A. Farhadi, “You only look once: Unified, real-time object detection,” in Proc. IEEE Conf. Comput. Vis. Pattern Recognit. (CVPR), pp. 779–788, 2016.
[6] J. Terven, D.-M. Córdova-Esparza, and J.-A. Romero-González, “A comprehensive review of YOLO architectures in computer vision: From YOLOv1 to YOLOv8 and YOLO-NAS,” Machines, vol. 11, no. 1, pp. 1–38, 2023.
[7] Ultralytics, “YOLOv11 model overview,” https://docs.ultralytics.com/models/yolo11/, 2025. Accessed: May 11, 2025.
[8] Ultralytics, “YOLOv12 model overview,” https://docs.ultralytics.com/models/yolo12/, 2025. Accessed: May 11, 2025.
[9] P. Zhu, L. Wen, D. Du, X. Bian, and H. Ling, “VisDrone-DET2018: The vision meets drone object detection in image challenge results,” in Proc. ECCV Workshops, 2018.